In an era where social networks are becoming the main “front” of the brand, measuring communication effectiveness is not only a mandatory requirement, but also a great challenge. When “volume of discussion” no longer fully reflects “quality of influence,” traditional measures gradually reveal limits.
In this context, the BSI Top10 2025 - a ranking developed and developed by Buzzmetrics over the past 10 years - is an attempt to redefine the standard for measuring the impact of social media campaigns.
The predecessor of the BSI Top10 is TopChart, which is based on two main criteria: the total discussion volume (buzz volume) and the sentiment score. In the early stages, these two indicators are enough to reflect the heat of the campaign, helping brands better understand how consumers react to their content.
However, as social media grew, user behavior changed rapidly, and marketing campaigns became more diverse and complex, Buzzmetrics realized that simply measuring “quantity” and “emotion” was not enough. Discussions can be generated from a variety of sources - including automated activity, virtual accounts, or even “buzz waves” that have no real value. Therefore, BSI Top10 has been constantly undergoing stages of improvement to keep up with the pace of development of Social Media Marketing, offering measures that increasingly reflect the nature of “Real Impact”.
2025 marks the fifth step and the biggest improvement: the introduction of the Qualified User Index - a group of real users who behave naturally and genuinely care about the brand. Buzzmetrics' AI system analyzes behavior, engagement frequency, and content diversity to identify “real” users - helping brands know not only how far a campaign is spreading, but also how it impacts real consumers.

This helps the BSI Top10 2025 survey not only record the spread of the campaign, but also help measure the real impact on real consumers.
After 10 months of applying the new evaluation system, the BSI Top10 2025 survey has shown many notable changes in the way communication campaigns are perceived and evaluated.
First of all, the buzz volume of the top campaigns is down significantly compared to 2024. Most of the campaigns recorded in the BSI Top10 2025 survey have not reached the 100,000 discussion threshold. This does not reflect a decline in communication activity, but on the contrary - an indication that Qualified User noise filtering is working. The worthless discussions, the sources of “virtual buzz” are gradually being eliminated, giving way to campaigns that have real influence in the community.
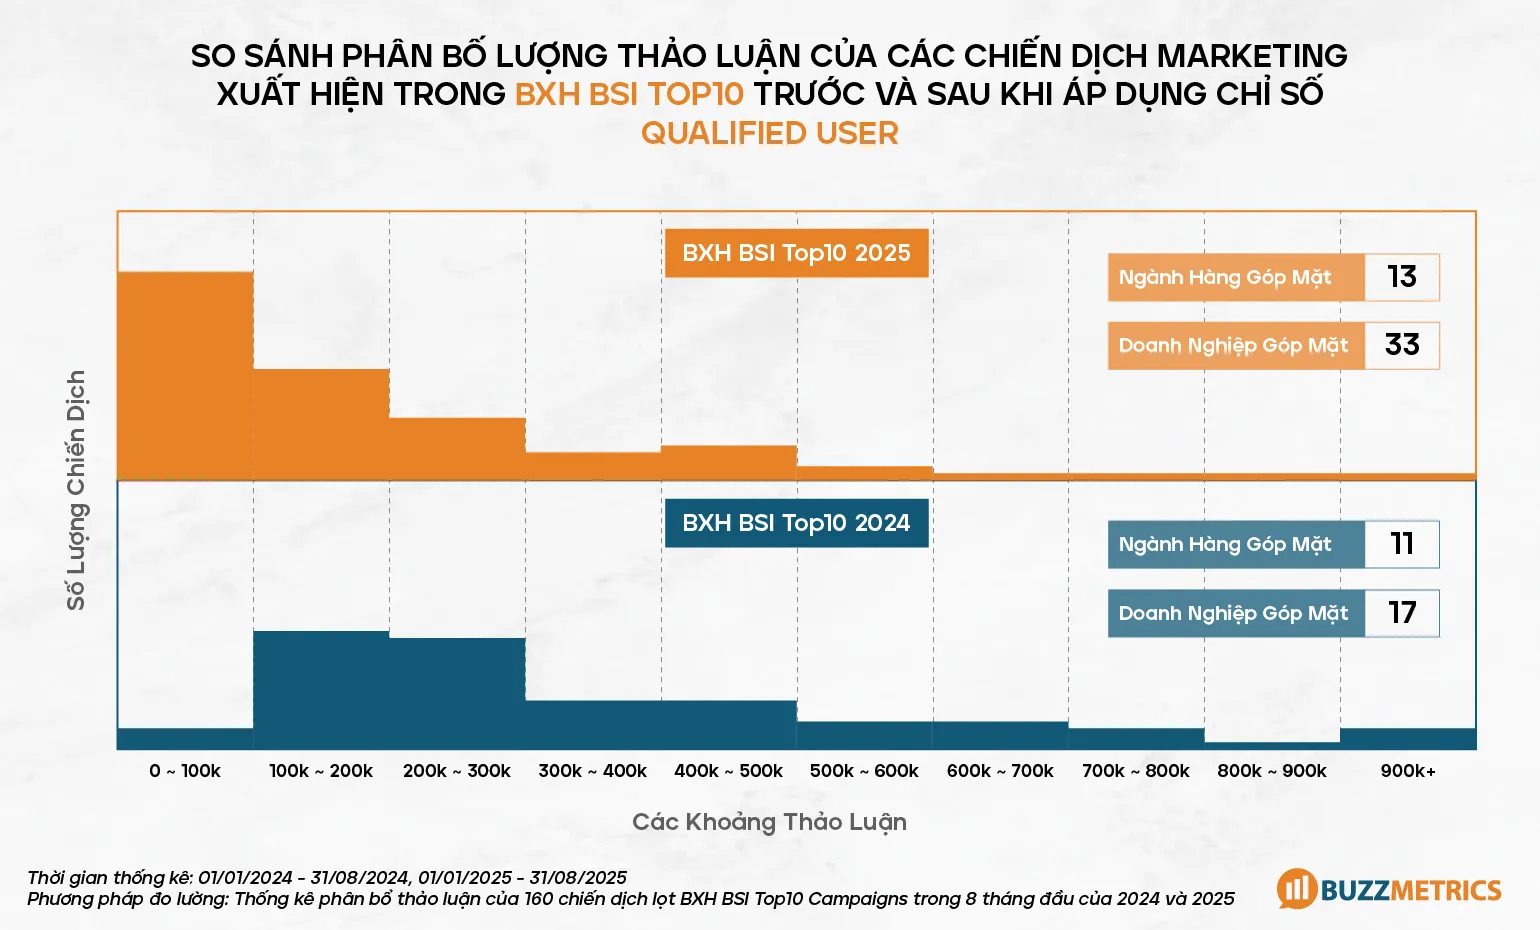
One of the most noticeable changes of the BSI Top10 2025 survey is the expansion of the goods sector. In the past, business often saw “house wars” - battles between brands jointly owned by several large companies. In 2025, the picture is already much richer. Sectors such as Gaming, Insurance, Healthcare, Real Estate, and Financial Services are beginning to appear in the industry, reflecting the proliferation of campaigns from industries that were previously less present on social media. The number of businesses involved has also increased significantly.
This shows that the social media playing field is not just limited to high-reach “big guys”, but has become a natural and effective connection channel for a variety of industries - as long as brands understand and tap into the right user insights.
Another notable point in the last 10 months has been the emergence of “small buzz” campaigns that have a profound impact - a testament to the power of the Qualified User Index.
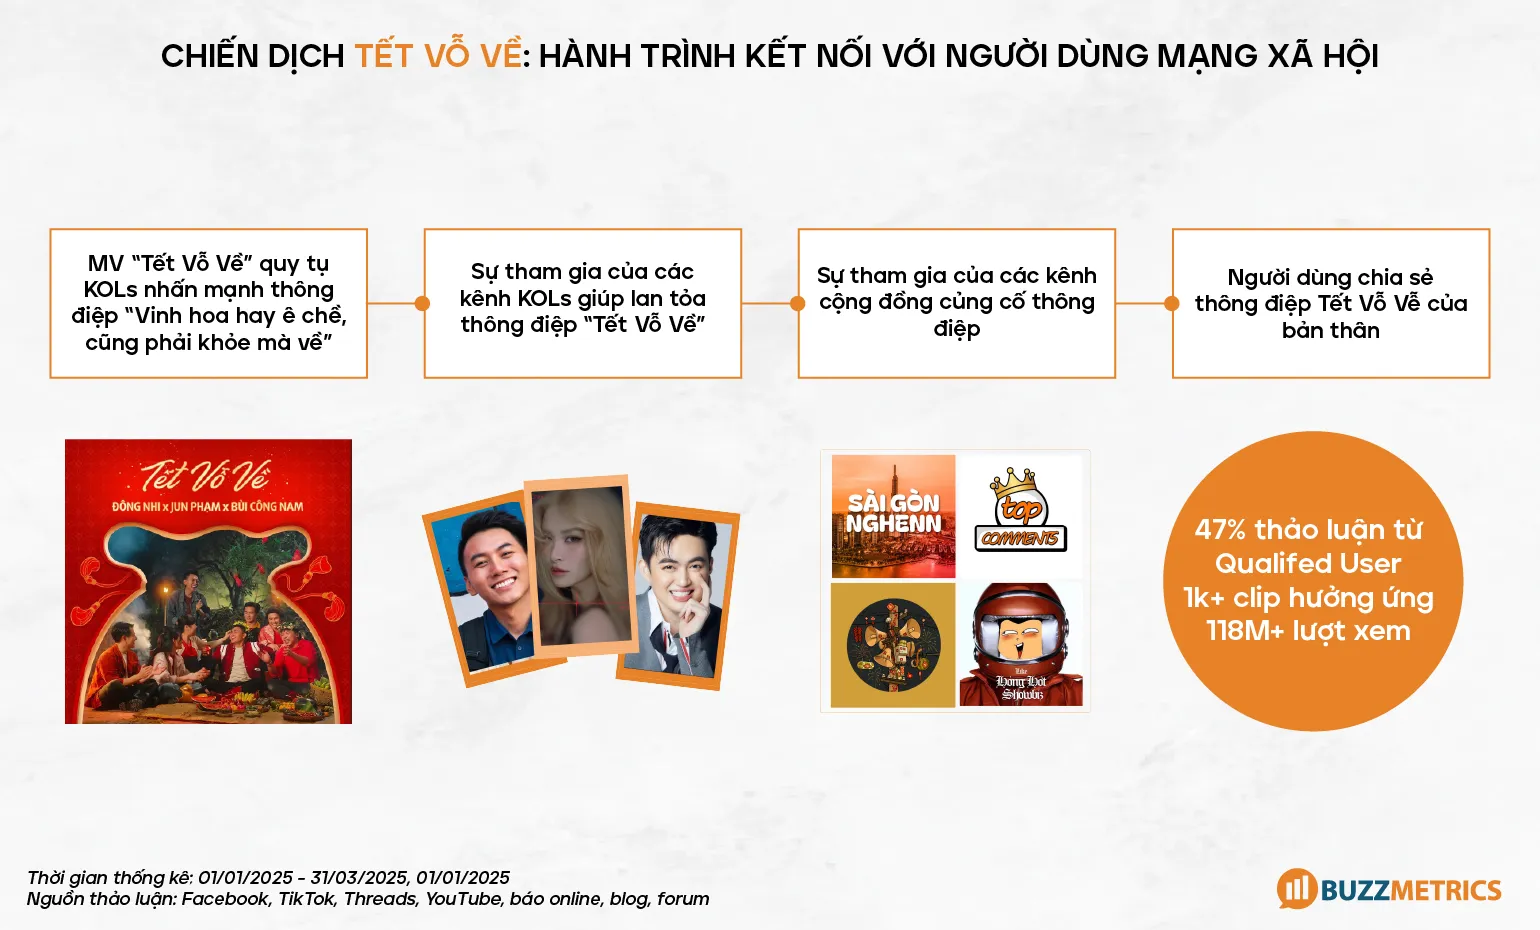
An example is the campaign “Tet Vau Zo” (January 2025). While only 76,412 discussions were generated, well below the general level of previous New Year campaigns, 36,109 of them came from Qualified Users - users who had real interactions, real discussions, and real feelings. Thanks to its high Content from Qualified User index, “Tet Vao” has become the most prominent campaign of the 2025 New Year, reflecting the spirit that BSI Top10 2025 aims to aim for: Put the quality of discussions at the top, instead of just running on huge discussion numbers.
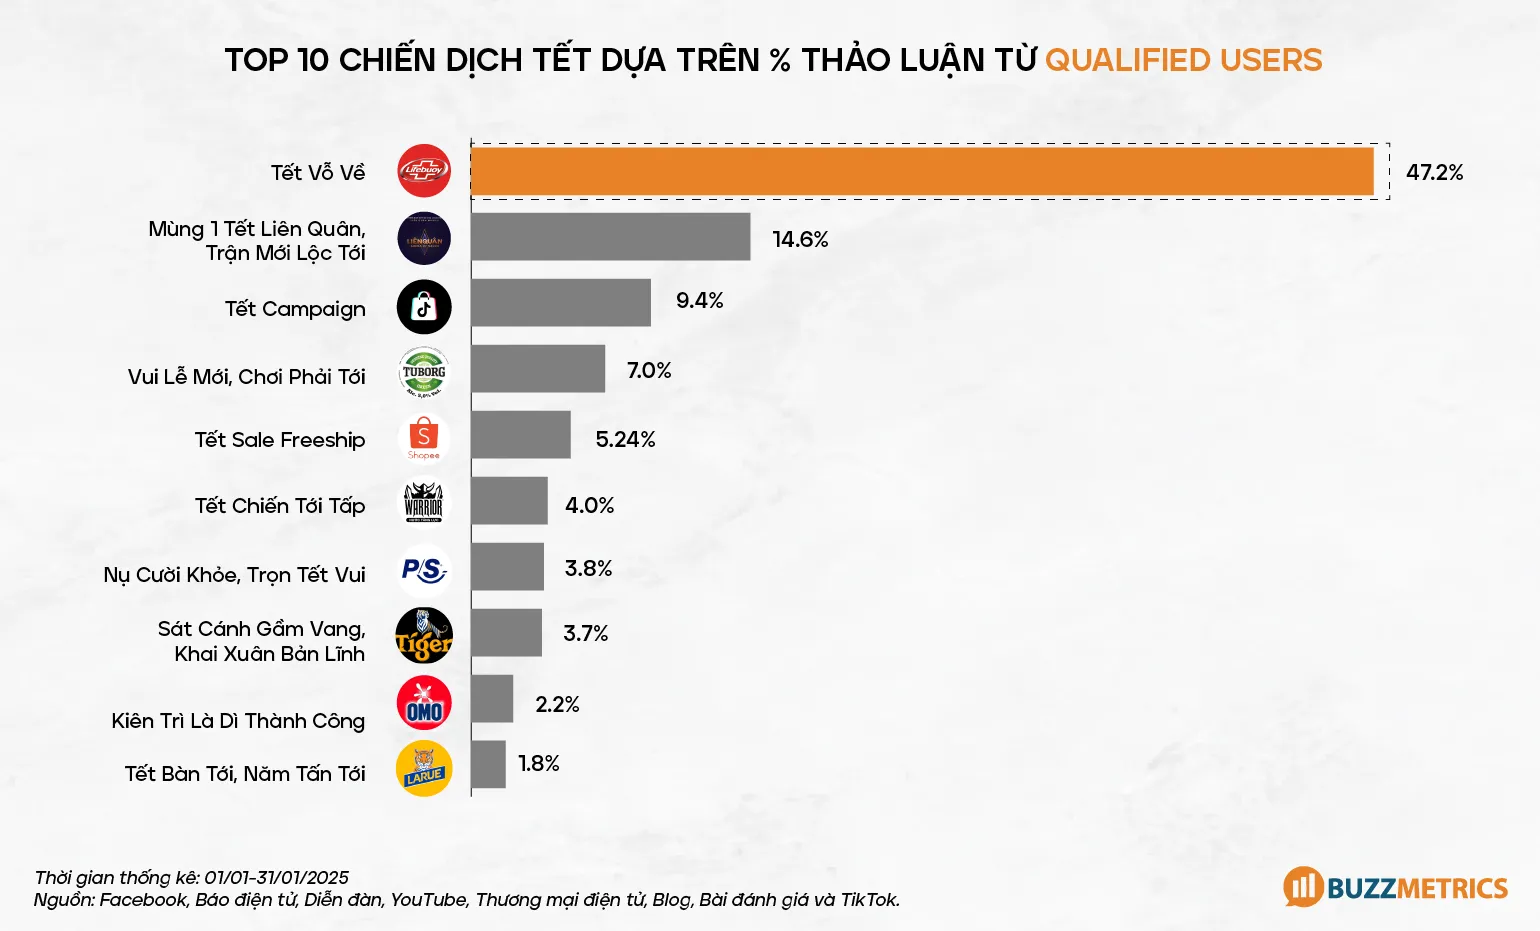
The success of this campaign comes from keeping up with Consumer Insight and deploying it synchronously across multiple channels: from Offline Activation, Music MV, Digital Content, Influencer Engagement to PR and product packaging. The uniformity in the message of “touching Vietnamese feelings on the occasion of the reunion” helps the campaign not only create a “buzz” on the surface, but also connect emotions and elicit genuine empathy from the public.
With landmark improvements in 2025, BSI Top10 continue to assert the position that the most reliable reference standard on the effectiveness of media campaigns in Vietnam.
But Buzzmetrics' journey doesn't stop there.
In addition to the BSI Top10, Buzzmetrics sees social media not as the destination of communication, but as the starting point of the journey to make a real impact for businesses. There, “Real Impact” manifests itself not only in diffusion, but also in the impact on business results and the emotions and behavior of consumers.
A successful campaign does not only stop at attracting interest on social networks, but must translate into concrete results: from the level of brand popularity, purchase intentions, to sales on e-commerce platforms. At the same time, this impact must be measured and demonstrated by data - through modern research indicators and models.
That's why Buzzmetrics has expanded its capabilities - from Social Media Research to Social & E-commerce Market Research.
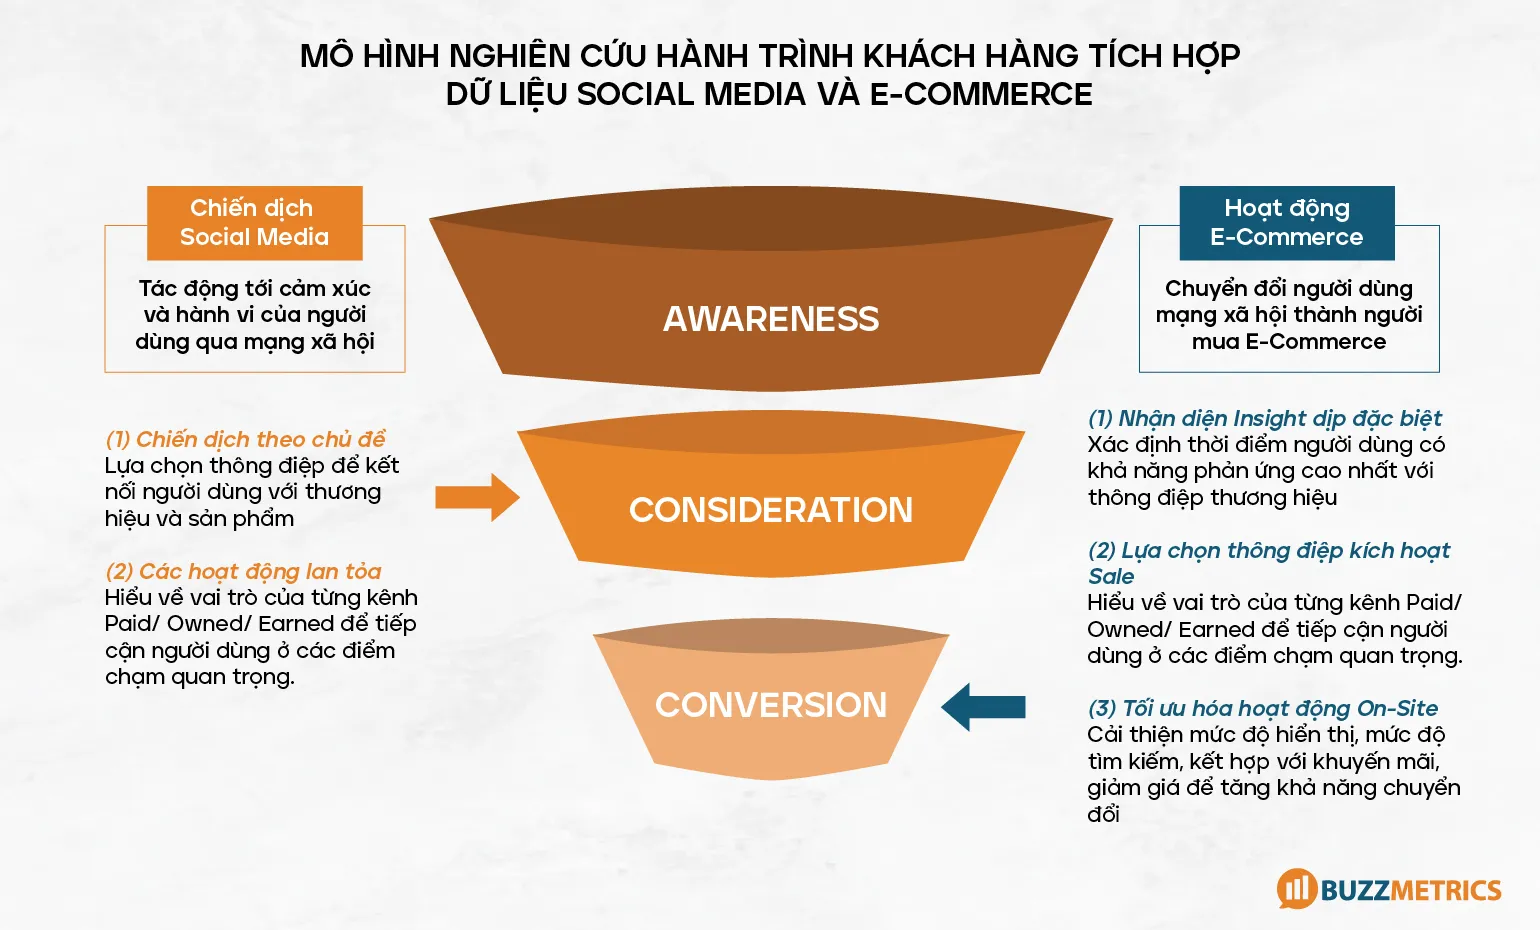
This research model allows brands to comprehensively evaluate the effectiveness of Digital Commerce, from communication effects to actual purchase conversions, while identifying the role of social media campaigns in the consumer journey.
In the age of data on the throne, “buzz” is no longer the only measure of success. When “real engagement” and “real value” come first, brands need to shift from “making noise” to “making a lasting impact.”
With in-depth research capabilities and integrated data systems, Buzzmetrics aims to accompany brands on their journey to understand consumers, accurately measure impact, and create real impact for both business and market.

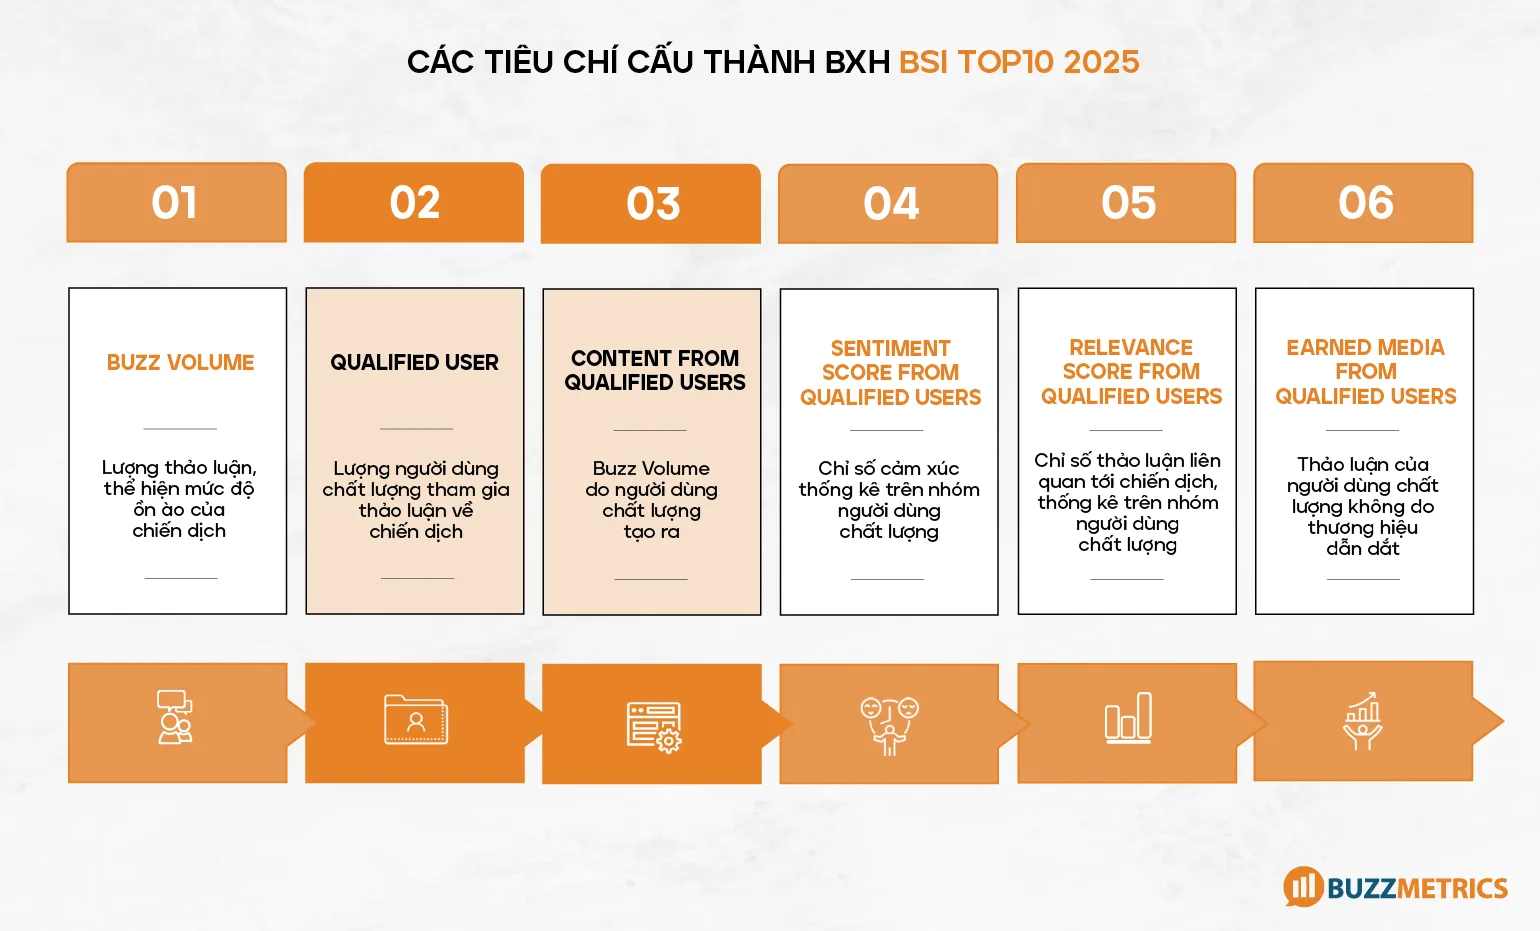
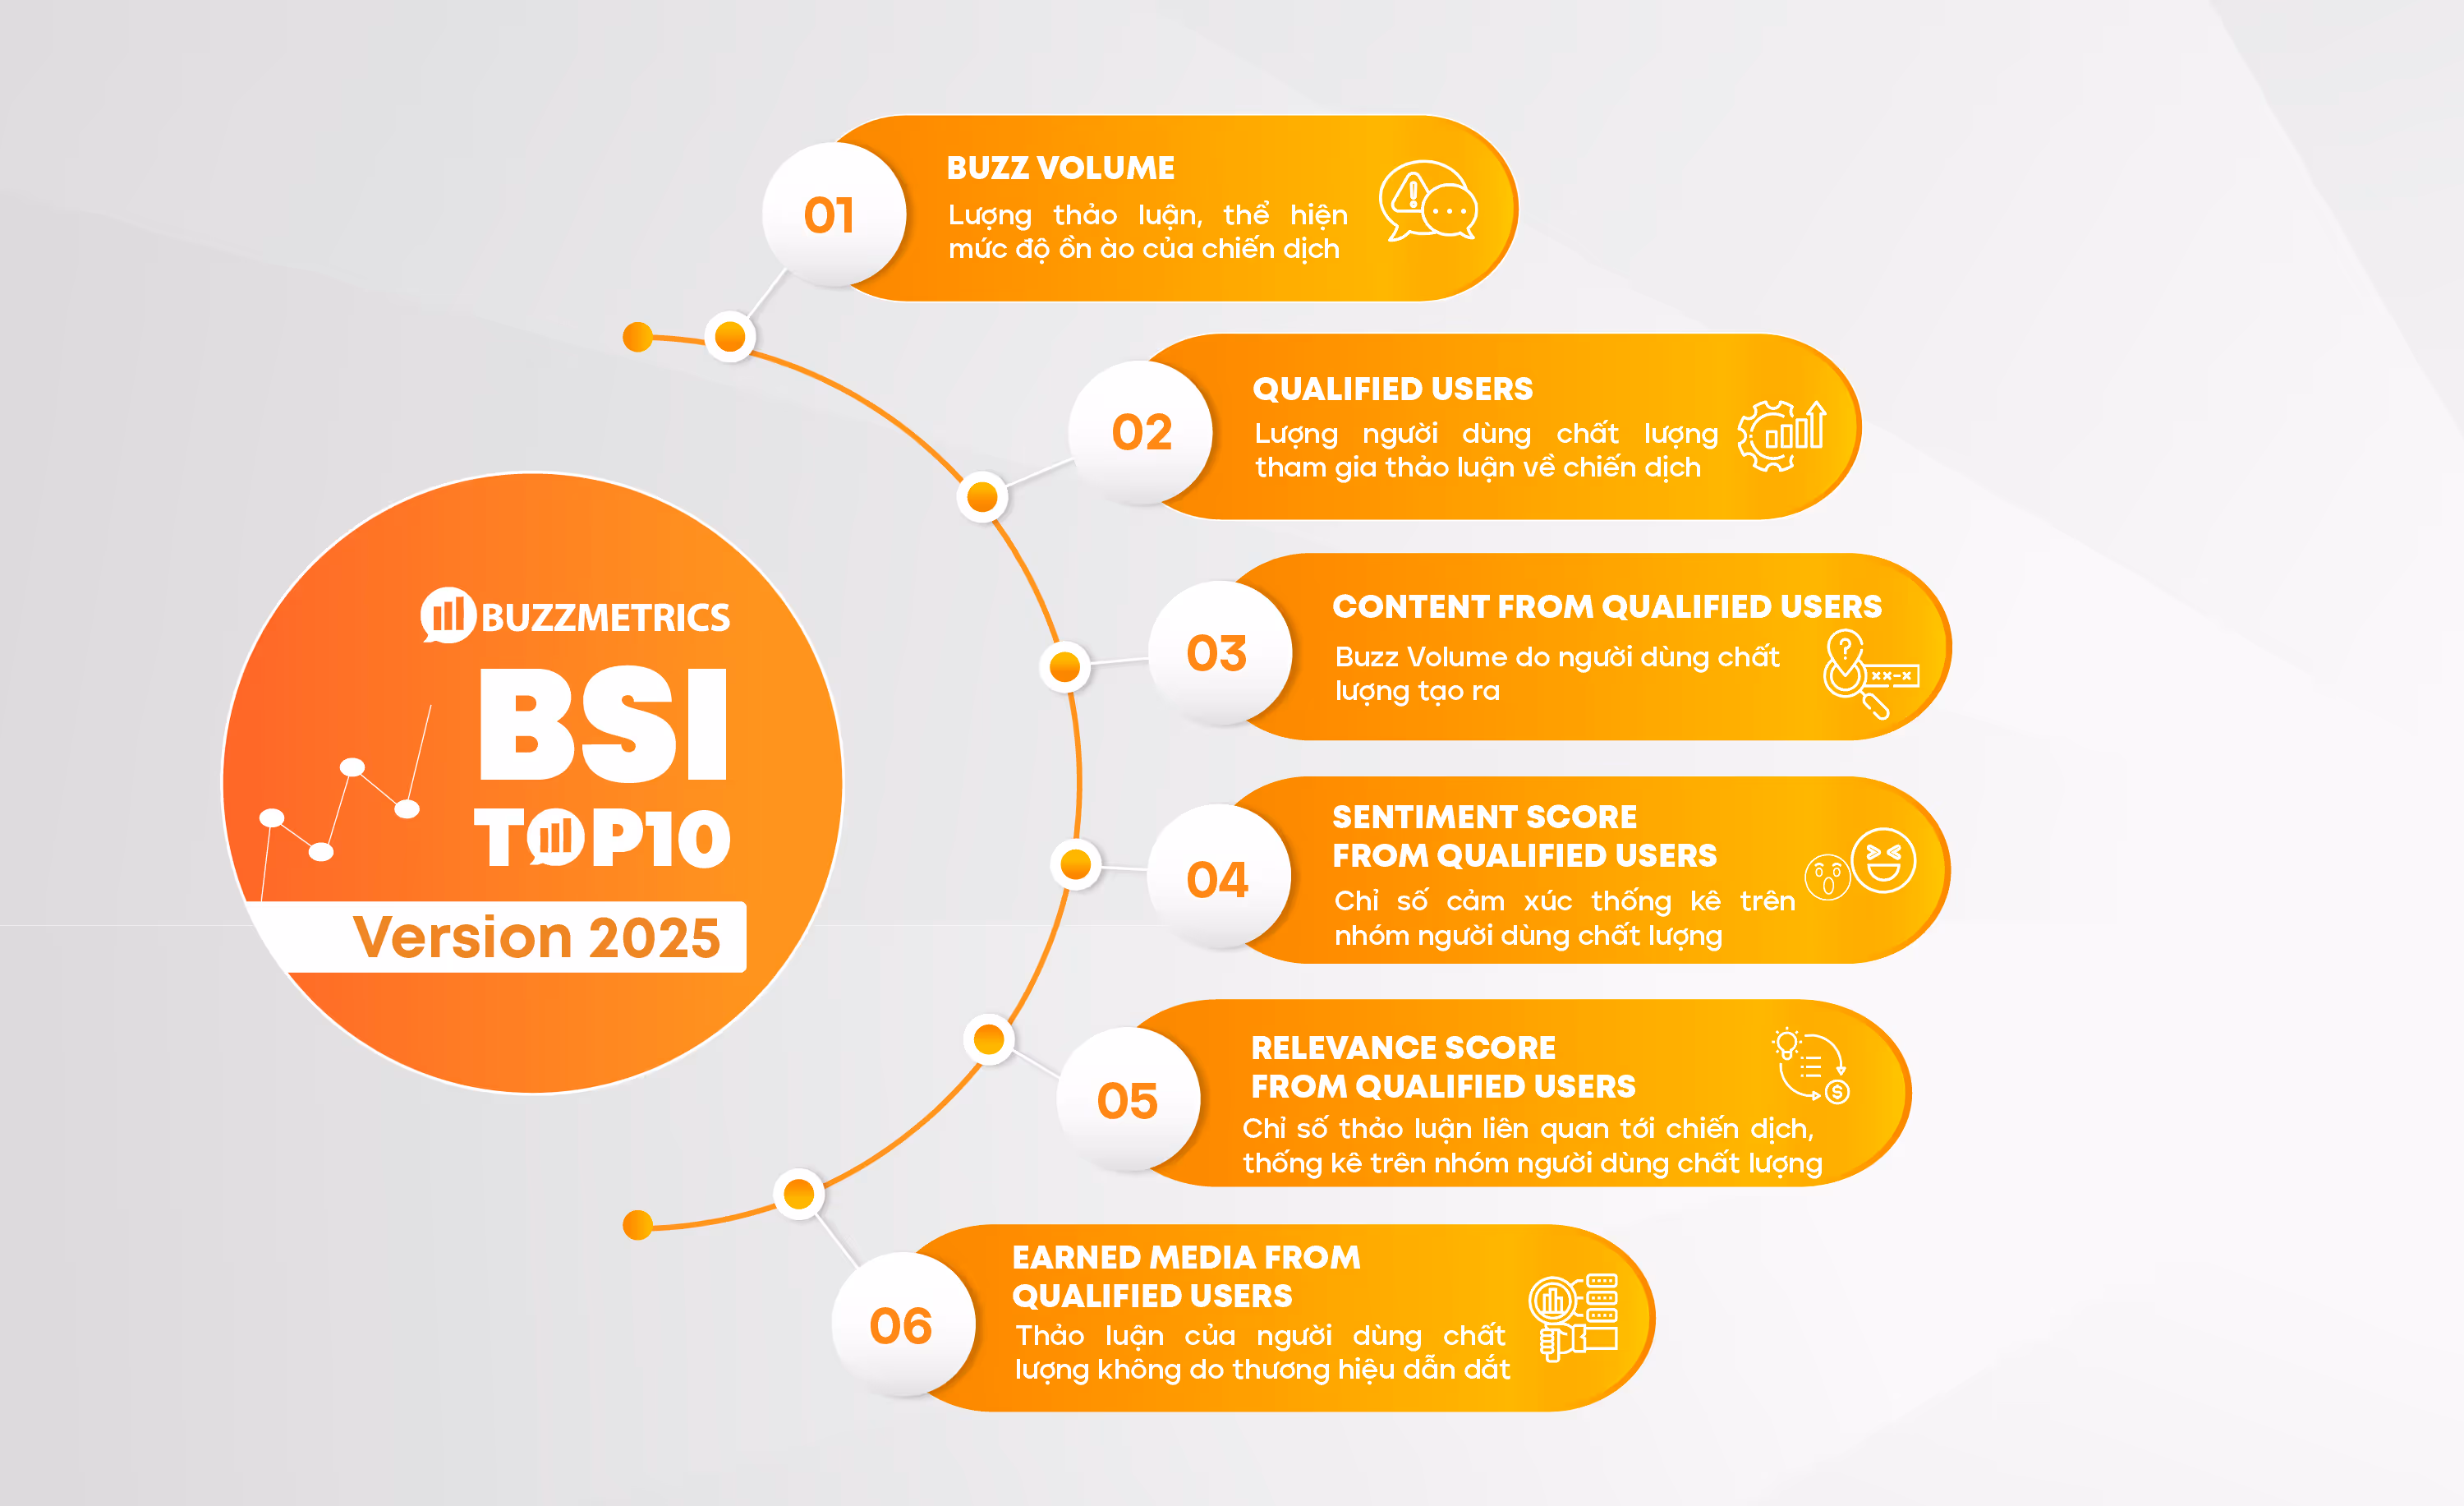
The BSI Top10 Ranking has been released by Buzzmetrics since October 2017. As of October 2022, BSI Top10 has recorded more than 11,500 campaigns on social media over the past 5 years. Today, BSI has become an important and reliable index, providing brands and agencies with perspectives on how to evaluate the effectiveness of social media campaigns. BSI is the aggregate of 6 indicators: Buzz Volume, Qualified Users, Content from Qualified Users, Earned Media from Qualified Users, Sentiment Score from Qualified Users, Relevance Score from Qualified Users.
To gain the recognition and support of the Marketing community, BSI has undergone a long journey of building and development. Initially, BSI was composed of 5 factors: Buzz Volume, Sentiment Score, Coverage, Object Mention, and User Generated Content (UGC).
In 2021, the BSI index was updated to keep up with the market and continue providing reference value for brands: Virality Score and Relevancy Score replaced Object Mention and UGC (User Generated Content). In 2023, as social media platforms became increasingly diverse and brands had more ways to reach users, BSI 2023 introduced two new metrics: Audience Score and Diversity Score.
However, the journey of improving the BSI Top10 Ranking did not stop there. In 2025, BSI once again evolved.
2025 saw the most radical improvements Buzzmetrics has ever applied to the BSI Top10 benchmark. Specifically as follows:
1. Qualified Users: The metric reflects the number of qualified users participating in discussions about campaigns/events/KOLs/TV shows. Qualified Users are those without abnormal signs in posting frequency or duplicated content on social media. This metric will be processed automatically based on intelligent algorithms developed by Buzzmetrics. Qualified Users is an enhancement of the Audience Scale/Audience Score.
2. Content from Qualified Users: The metric reflects the amount of discussion generated by qualified users. Content from Qualified Users is an enhancement of the Diversity Score.
3. Earned Media from Qualified Users: The metric reflects the amount of organic discussion generated by qualified users, not driven by brands. Earned Media from Qualified Users is an enhancement of the Virality Score.
4. Sentiment Score from Qualified Users: The metric reflects the positive/negative/neutral attitudes of qualified users. Sentiment Score from Qualified Users is an enhancement of the Sentiment Score.
5. Relevance Score from Qualified Users: The metric reflects the volume of discussions generated by qualified users that are relevant to the campaign/event/KOLs/TV shows. Relevance Score from Qualified Users is an enhancement of the Relevance Score.
6. Buzz Volume: The total discussion about a campaign/event/KOLs/TV shows. This is a fundamental metric inherited from previous versions of the BSI Top10 Ranking.
With the new metrics related to Qualified Users, Buzzmetrics aims to better evaluate the authenticity of a campaign. This group of metrics will help answer the question: Does the campaign win users through the brand’s message or through interaction-driven tactics? In doing so, the BSI Top10 Ranking brings well-deserved recognition to campaigns that generate positive impact.
Through multiple updates, the BSI Top10 Ranking has reflected Buzzmetrics’ effort to deliver real value to brands by helping them evaluate the effectiveness of campaigns/events/celebrities on social media. In the 2023 version, besides discussion quality, discussion diversity (Diversity Score) and participant quality (Audience Score) were also considered. The 2025 version is an upgrade of 2023 by introducing the Qualified Users metric. Qualified Users will contribute to evaluating and ensuring the quality of other metrics.
However, the BSI Top10 Ranking 2025 is not the final version, as Buzzmetrics will continue to make further improvements to best recognize and evaluate brand efforts on social media.

In March 2016, Buzzmetrics first released a ranking of brands, campaigns, events, and celebrities by buzz volume on social media under the name TopChart. The Top Chart works based on 2 main criteria: Total amount of discussion and Emotion Index.
Top 10 campaigns of the TopChart Ranking in September 2016:

After 6 months of release, until September 2016 BuzzMetrics there was an improvement to the TopChart charts when Total amount of discussion and Emotion Index does not fully reflect the efforts of the marketer. TopChart is renamed to TopBuzz chart and added index Total interaction (Like + Share + Comment).
Top 10 campaigns of the TopBuzz Ranking in October 2017:

The old version of BSI Top10 was improved from TopBuzz as social media increasingly reflected brand health, consumer sentiment, and purchase intentions. Thus, the indicator Total amount of discussion (Buzz Volume) of TopBuzz charts is no longer the only factor that can show the full impact on the success of a campaign/event/brand or celebrity. As a result, Buzzmetrics upgraded the TopBuzz Ranking into the BSI Top10 Ranking with 5 indicators to provide a more comprehensive evaluation of effectiveness and impact of campaigns/events/celebrities.
BSI Top10 Campaigns Ranking in August 2020:

In the 2021 version, campaign/event/celebrity needed to pay more attention to the quality of discussions, as BSI Top10 2021 not only considered how users perceived campaign/event/celebrity (Relevancy Score) but also emphasized the sources of discussions (Virality Score).
BSI Top10 Campaigns Ranking in October 2021:

BSI version 2023 introduced two additional quality measurement indicators, that is:
1. Diversity Score: shows the degree of diversity in the content of discussions on social networks. When social networks are social with a diversity of colors, personalities, and value systems, social media users will naturally have diverse responses with their different opinions and stories. This indicator is intended to assess the degree of natural interaction of the commercial campaign with network users.

2. Audience Score: As the majority of Vietnamese already have social media accounts, the presence of too many newly created accounts involved in the discussion of a brand activity does not represent attractiveness for natural users. This metric is intended to assess how attractive a commercial campaign is to natural users compared to “fans” creating virtual accounts in support of a brand or celebrity.
Here are 2 more clarifying indicators: quality of discussion and the quality of the account. Diversity Score and Audience Score will be automatically assessed based on system-wide engagement based on more than 2,000 annual commercial campaigns measured by Buzzmetrics.
In addition, the new BSI index (version 2023) still maintained the same criteria for assessing the success of social media campaigns/events/influencers in an overview based on 5 core factors; that is: