For many years, social media was often seen simply as a communication channel—a place where brands distributed content or launched campaigns to increase awareness. However, as consumer behavior becomes increasingly tied to social platforms, the way brands understand and engage with the market is also changing. Conversations on social media today almost instantly reflect how consumers think, feel, and respond to brands. From needs and emotions to emerging trend signals, everything is expressed through the daily discussions taking place on social media. In this context, many marketers are beginning to adopt a Social-First approach—placing social media at the center of their marketing strategy.
With a Social-First approach, social media is no longer just a communication channel—it becomes the infrastructure of marketing activities, a new kind of “operating system” for how brands run their strategies.
In this model, every interaction between brands and consumers is reflected through real-time conversations on social media. These discussions not only help brands understand how users perceive their products, but also provide critical signals about market needs and expectations, the topics gaining attention, and emerging trends.
As a result, social data is no longer used solely for communication purposes; it becomes a strategic source of insight, enabling brands to make more accurate and timely marketing decisions.
1. Social platforms are becoming an “information ecosystem”
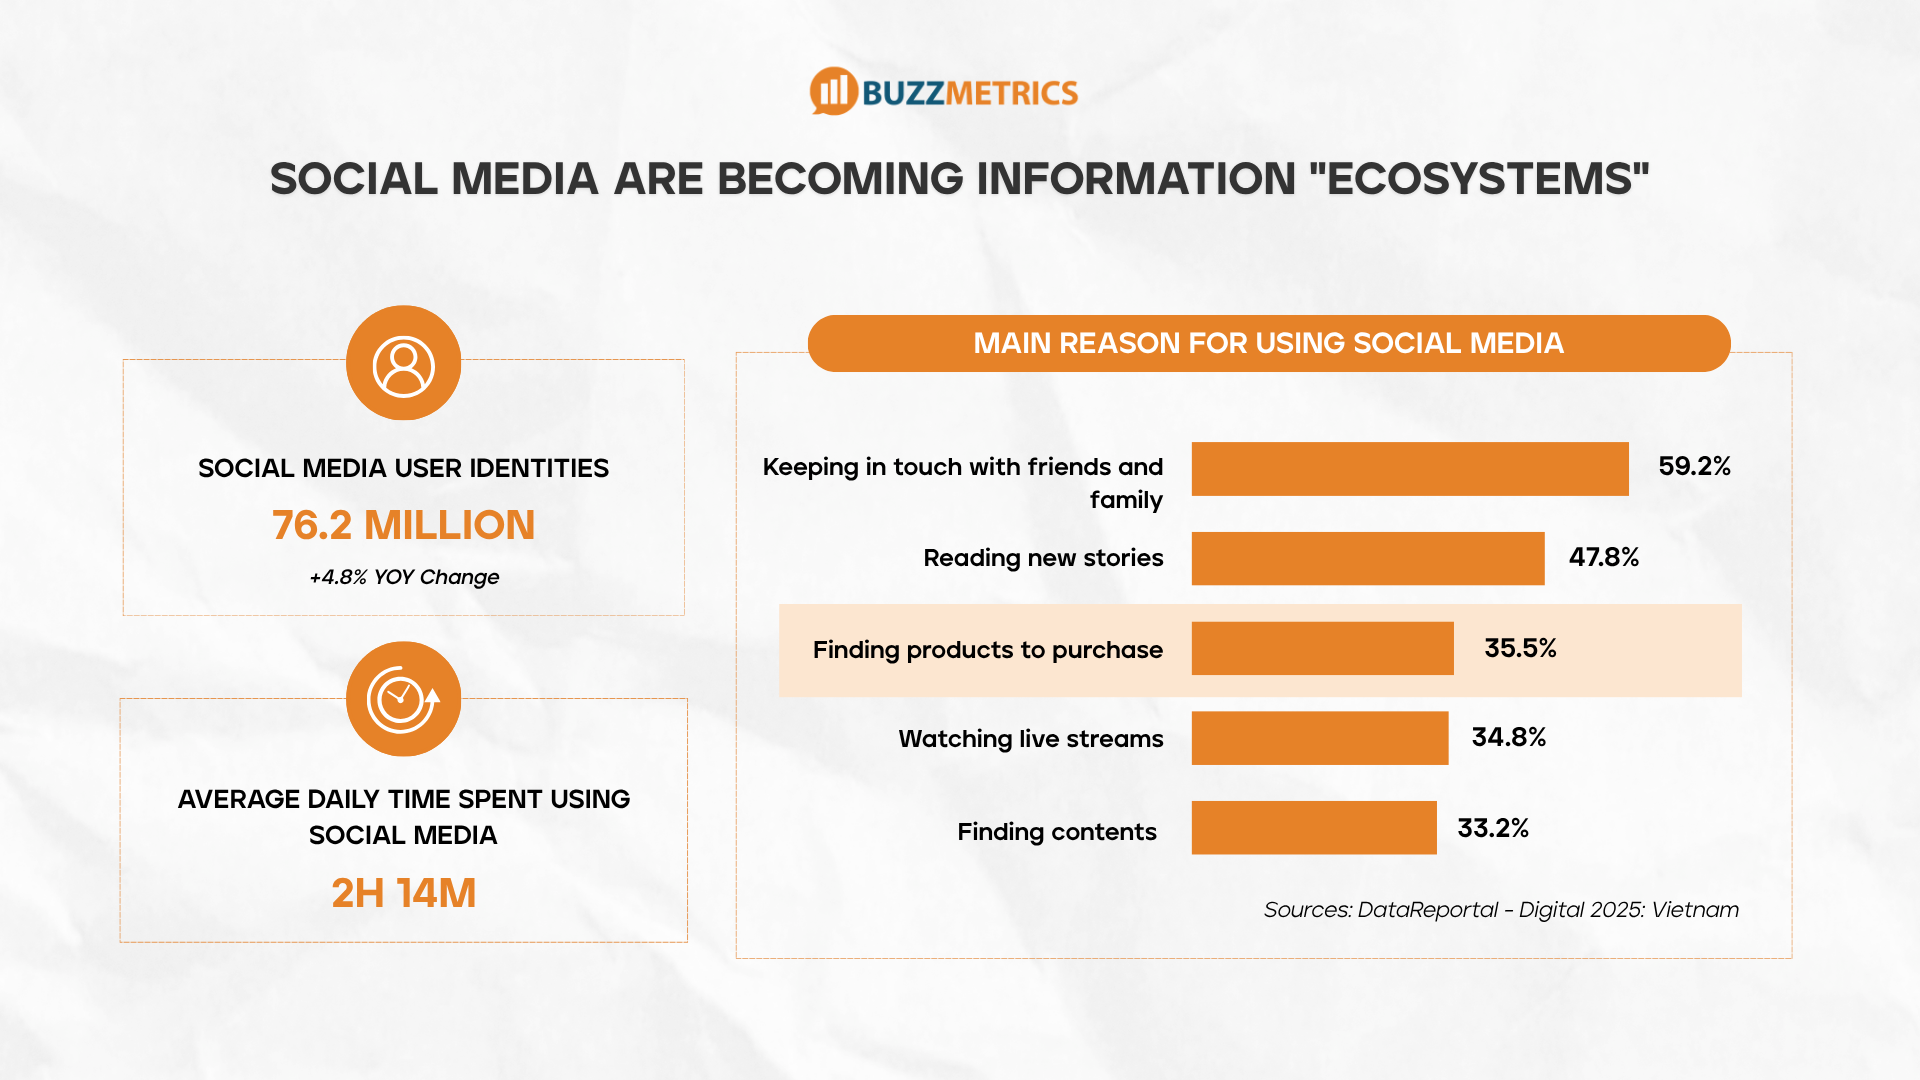
According to the Digital 2025 Vietnam report, Vietnam currently has 76.2 million social media users, with an average usage time of 2 hours and 14 minutes per day. Notably, 35.5% of users say they use social media to search for products before making a purchase. This reflects an important shift: social media is no longer just a place for content consumption—it has become a critical touchpoint throughout the entire customer journey.
In this context, a brand’s presence on social platforms is not only about maximizing reach, but also directly influences how consumers form perceptions and evaluate their choices.
2. Changing consumer behavior – Purchase decisions are increasingly shaped by community interactions
In the social media environment, purchase decisions are no longer formed entirely at an individual level. Consumers increasingly seek opinions, follow others’ experiences, and are influenced by public discussions before making their final choice.
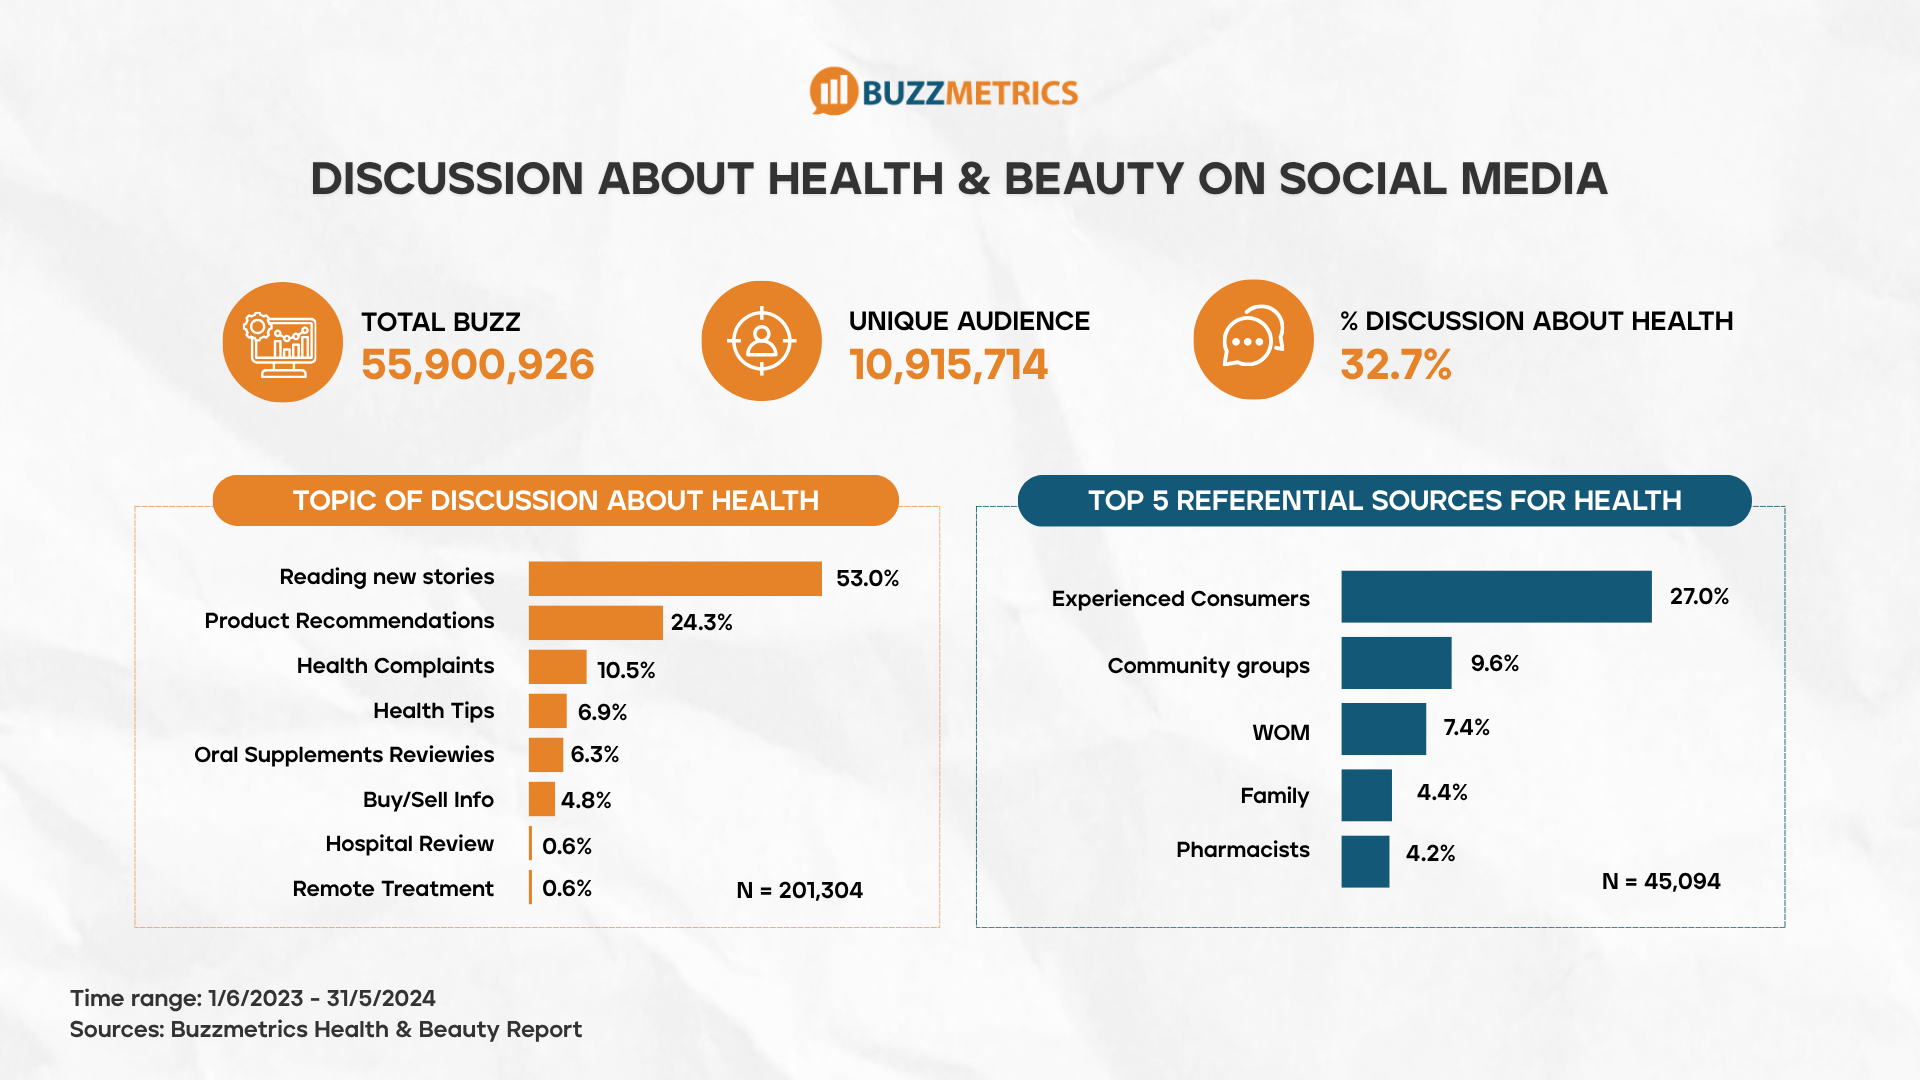
This trend is clearly reflected in a Health & Beauty industry report by Buzzmetrics. Over the course of a year, the industry recorded 55.9 million discussions and 10.9 million participants—showing that social media is not just a place to talk about products, but a space where consumers actively exchange needs and experiences.
Notably, among health-related discussions, 53% revolve around symptoms and solutions, while 24.3% focus on product recommendations. This indicates that decision-making is no longer purely individual, but gradually shaped through asking, comparing, and referencing community opinions.
This reality is further reinforced by the fact that the most trusted sources are people with real-life experience (27%), significantly outweighing professional or expert sources. In the social environment, community-driven experiences play a decisive role in shaping consumers’ final choices.
3. Market signals are shifting from “research-based” to “conversation-based”
If brands once relied mainly on periodic market research to understand consumers, today social media conversations have become a continuous stream of market signals. These discussions allow brands to observe how needs, expectations, and trends are forming and evolving in real time—rather than capturing just a static snapshot of the market at a single point in time.
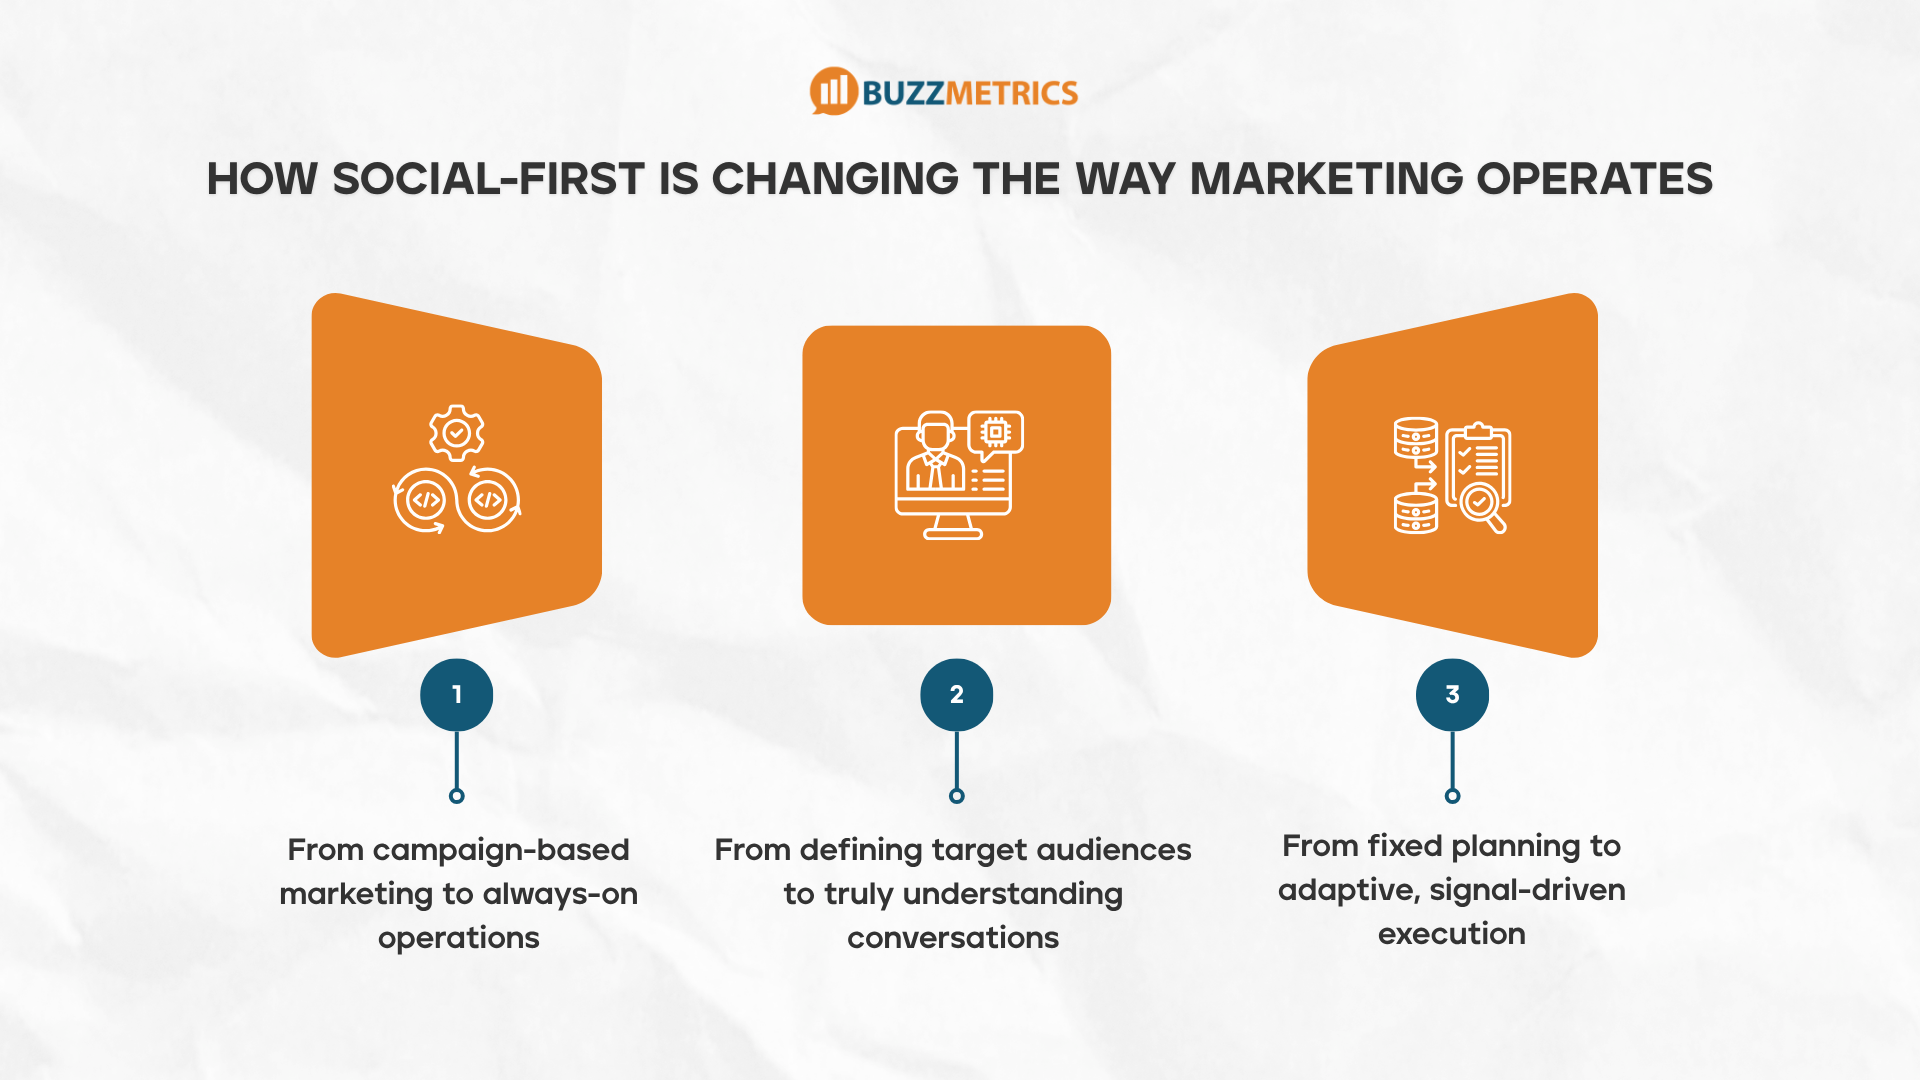
1. From campaign-based marketing to continuous operations
In traditional models, marketing is executed in distinct campaigns with clear lifecycles: planning, execution, measurement, and closure. In a Social-First environment, however, market signals emerge daily through ongoing consumer conversations on platforms like TikTok and Facebook. As a result, marketing is no longer a series of separate phases—it becomes a continuous operating system, where content, messaging, and activities are constantly refined based on real-time market feedback.
2. From defining target audiences to understanding conversations
Previously, marketing focused on identifying the right target audience and crafting messages tailored to that group. In the social era, the key question is no longer just “who is the customer?” but also “what are they talking about?”
Social conversations reveal what consumers care about, what they debate, and which narratives shape their perception of brands. Marketing, therefore, shifts from targeting the right audience to understanding the right conversation context.
3. From fixed planning to adaptive execution
As consumer needs and expectations evolve in real time, rigid, months-long marketing plans become less effective. Instead, brands must continuously track market signals and adjust content, messaging, and execution in response to actual user reactions. In a Social-First context, marketing is no longer just about building plans—it’s about the ability to adapt quickly to ongoing changes in the market.
The shift to Social-First isn’t just about communication—it requires brands to rethink how marketing operates at a system level.
First, elevate social media research to a decision-making foundation. Social listening is no longer a supporting tool; it becomes the starting point for strategy. Platforms like TikTok and Facebook continuously reflect consumer thoughts, needs, and expectations. Tracking and analyzing these signals is essential for understanding the market and responding in time.
Second, treat content as a continuous system—not a campaign output. Content is no longer something you “produce and publish” once. It becomes an ongoing cycle of creation, testing, and optimization, shaped by real user feedback rather than fixed plans.
Third, turn insight into real-time input for action. Insight is no longer a retrospective report. Its value lies in helping brands detect early shifts in consumer behavior and perception—so they can adjust strategy and execution proactively, not reactively.
As social media takes on a bigger role in shaping consumer decisions, a gap in how marketing effectiveness is measured begins to surface. Today, many brands still rely on familiar metrics like buzz, engagement, and reach—often gathered from platforms such as Facebook or TikTok. These indicators reflect how active a campaign is, but they don’t fully capture the real impact social has on the brand. In reality, not every conversation drives decisions, not every interaction changes perception, and high visibility doesn’t necessarily translate into meaningful influence. This creates a common risk: brands may achieve strong-looking numbers on social media while failing to generate actual shifts in consumer behavior or mindset. This is often referred to as “vanity metrics”—surface-level indicators that suggest success, but don’t truly reflect marketing effectiveness.
In a Social-First world, the challenge is no longer just measuring activity, but understanding impact: Are conversations changing how people feel? Are they influencing consideration and choice? Without answering these deeper questions, brands risk optimizing for noise instead of value.
.png)
Social-First signals a fundamental shift in marketing: social media is no longer just a communication channel, but a central source of market signals—where consumer needs, perceptions, and decisions are shaped through ongoing conversations on platforms like TikTok and Facebook.
As marketing evolves into a continuous, signal-driven system, measurement frameworks must evolve accordingly. Relying solely on familiar metrics such as buzz, engagement, or reach makes it difficult for brands to fully understand the real impact of social media on shaping perception and influencing behavior.
This raises a critical question: if social media plays a role in forming decisions, how can its true impact on brands be accurately measured?
That is precisely why new measurement approaches and operating models like Marketing Systems OS are becoming essential—helping brands systematically connect conversation data with metrics of perception and behavior.

The Lunar New Year (Tet) season has always been the most fiercely competitive "battleground" of the year for Vietnamese marketers, where brands pour their full resources into capturing the minds and hearts of consumers. As no exception, the upcoming Tet 2026 is forecasted to witness a race more intense and cutthroat than ever before.
As previously noted by Buzzmetrics, even before the first week of 2026 had passed, nearly 60 Tet campaigns had already been launched. In just the following 7 days (from January 5th to 12th), the market witnessed a quantum leap:
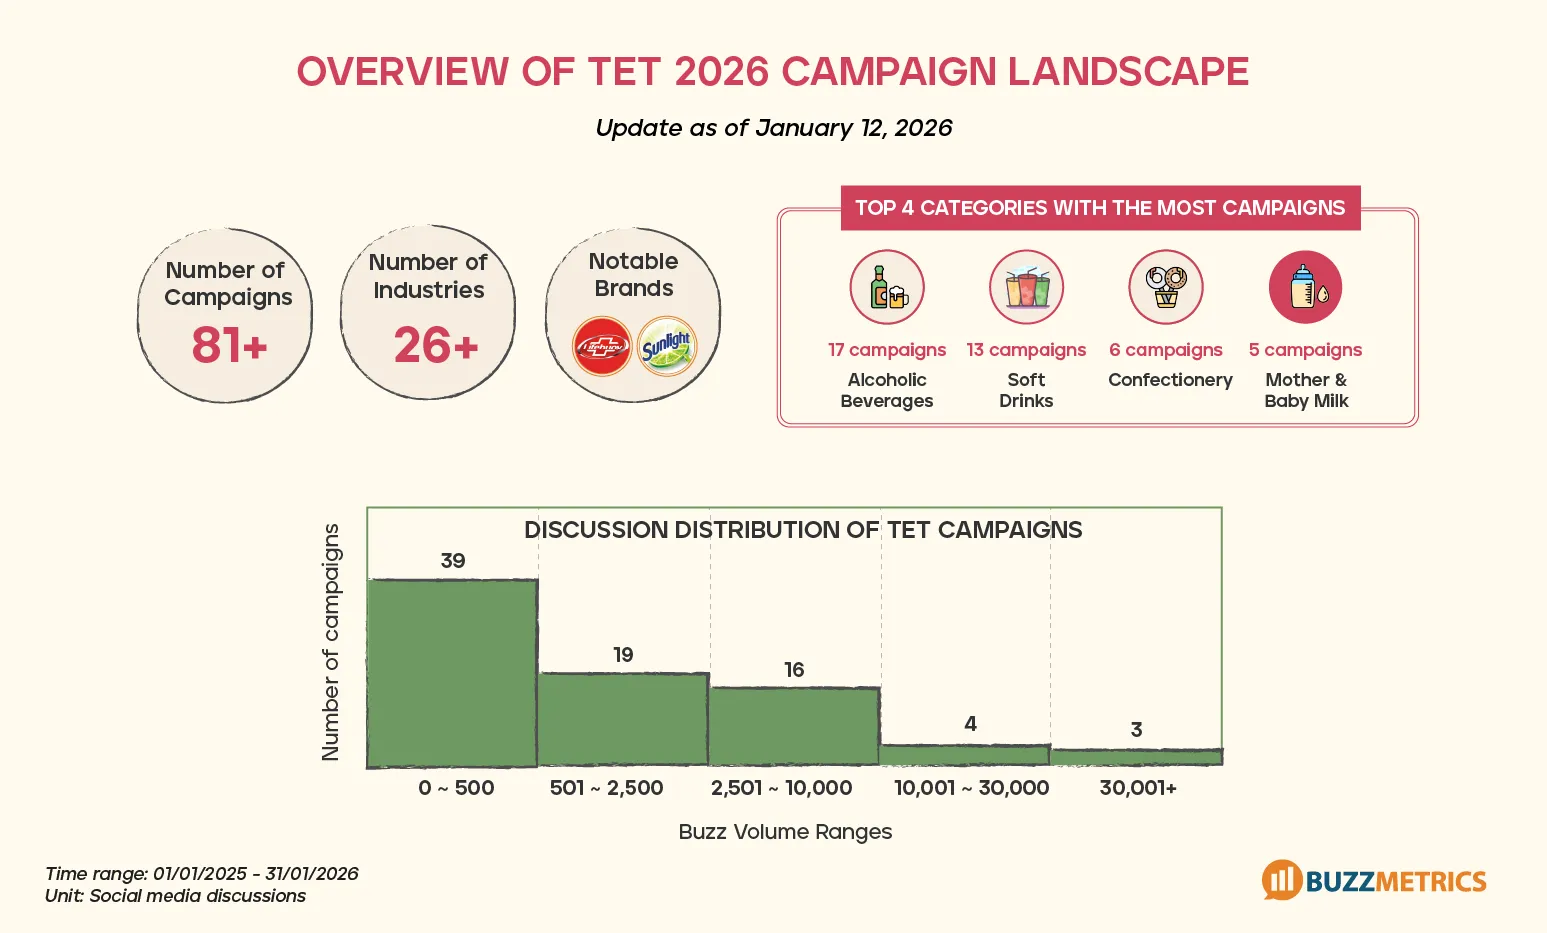
Campaigns are increasingly differentiating in terms of discussion volume thresholds, reflecting intense competition. Whereas last week the top campaign only reached around 10,000 buzz, the leading group has now surged powerfully into the range of 30,000 to 50,000 buzz.
As the Tet race heats up by the hour, the most pressing question is no longer “How many discussions do we have?” but rather “How many of those discussions are truly meaningful?” In this context, Qualified Metrics - Buzzmetrics’ system of quality-based indicators- has become the guiding compass for uncovering real effectiveness behind explosive numbers.
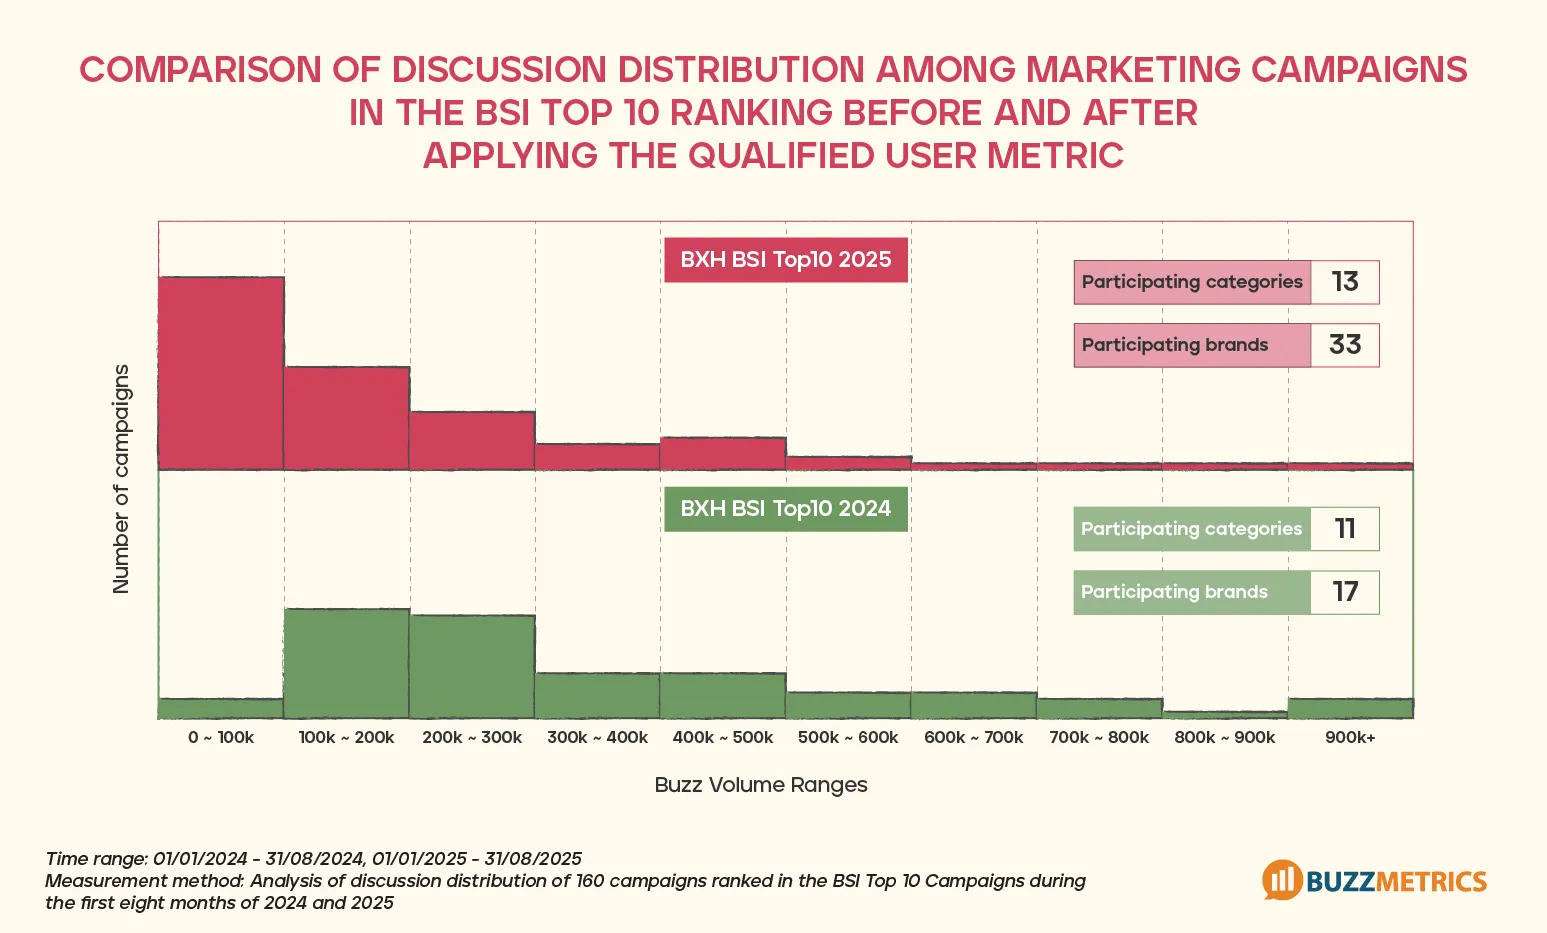
Tet 2025 marked the first season Buzzmetrics applied Qualified Metrics in campaign evaluation, leading to what can be described as a “positive disruption.” Campaign rankings before and after the application shifted significantly. Campaigns that once appeared dominant in terms of Buzz Volume suddenly dropped, replaced by less noisy campaigns with higher-quality discussions and more valuable user participation.
So, what exactly are Qualified Metrics? And how do they reshape the way campaign impact is measured? Let’s explore together in this article.
In the early days of social media analysis, one commonly referenced metric was Total Audience- the number of users generating discussions. This metric helped brands roughly estimate campaign reach. However, Total Audience fails to account for “abnormal” accounts- those created in bulk or operating at unnatural posting frequencies, often sharing content mechanically. This posed a major challenge in campaign effectiveness evaluation.
Recognizing this issue, Qualified User emerged as a smart filtering layer pioneered by Buzzmetrics. A user is considered Qualified only when they meet strict criteria:
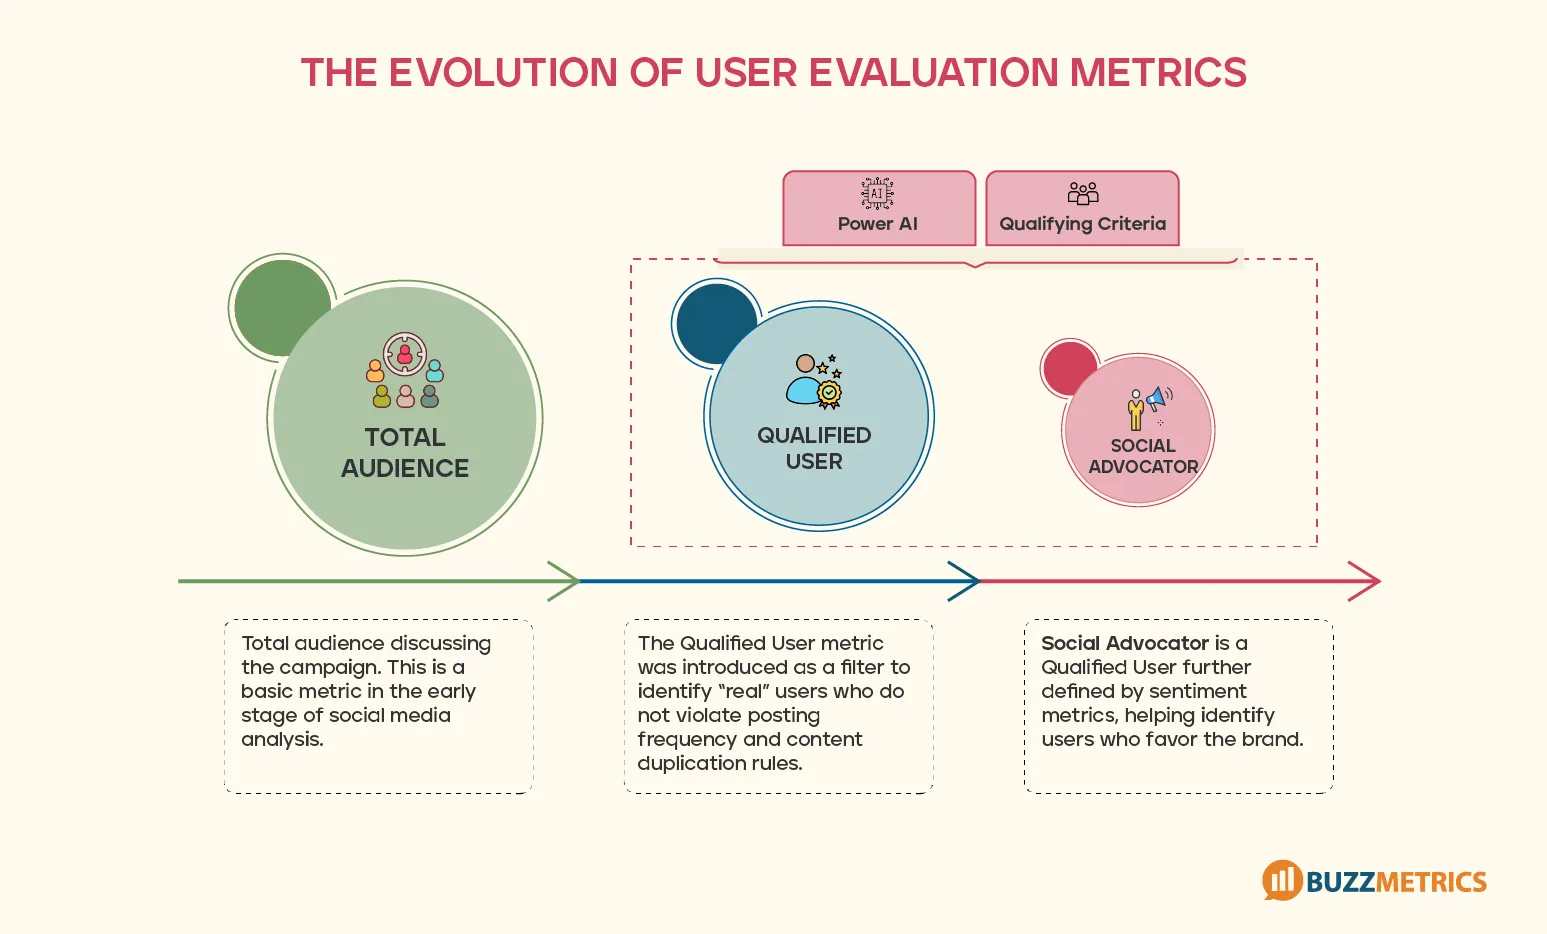
Identifying Qualified Users within a complex social environment marks a significant advancement in data analysis. It helps eliminate noise and refocus efforts on user groups with real conversion potential. When a Qualified User not only discusses a campaign but also expresses preference, support, and voluntarily shares positive brand-related content, they become a Social Advocator. This is the most valuable asset of any Tet campaign, as their voice carries far more weight than conventional advertising posts.
Qualified User is not just another data point. In practice, it functions as an underlying “operating system” that influences and constrains other metrics, forming the broader Qualified Metrics ecosystem.
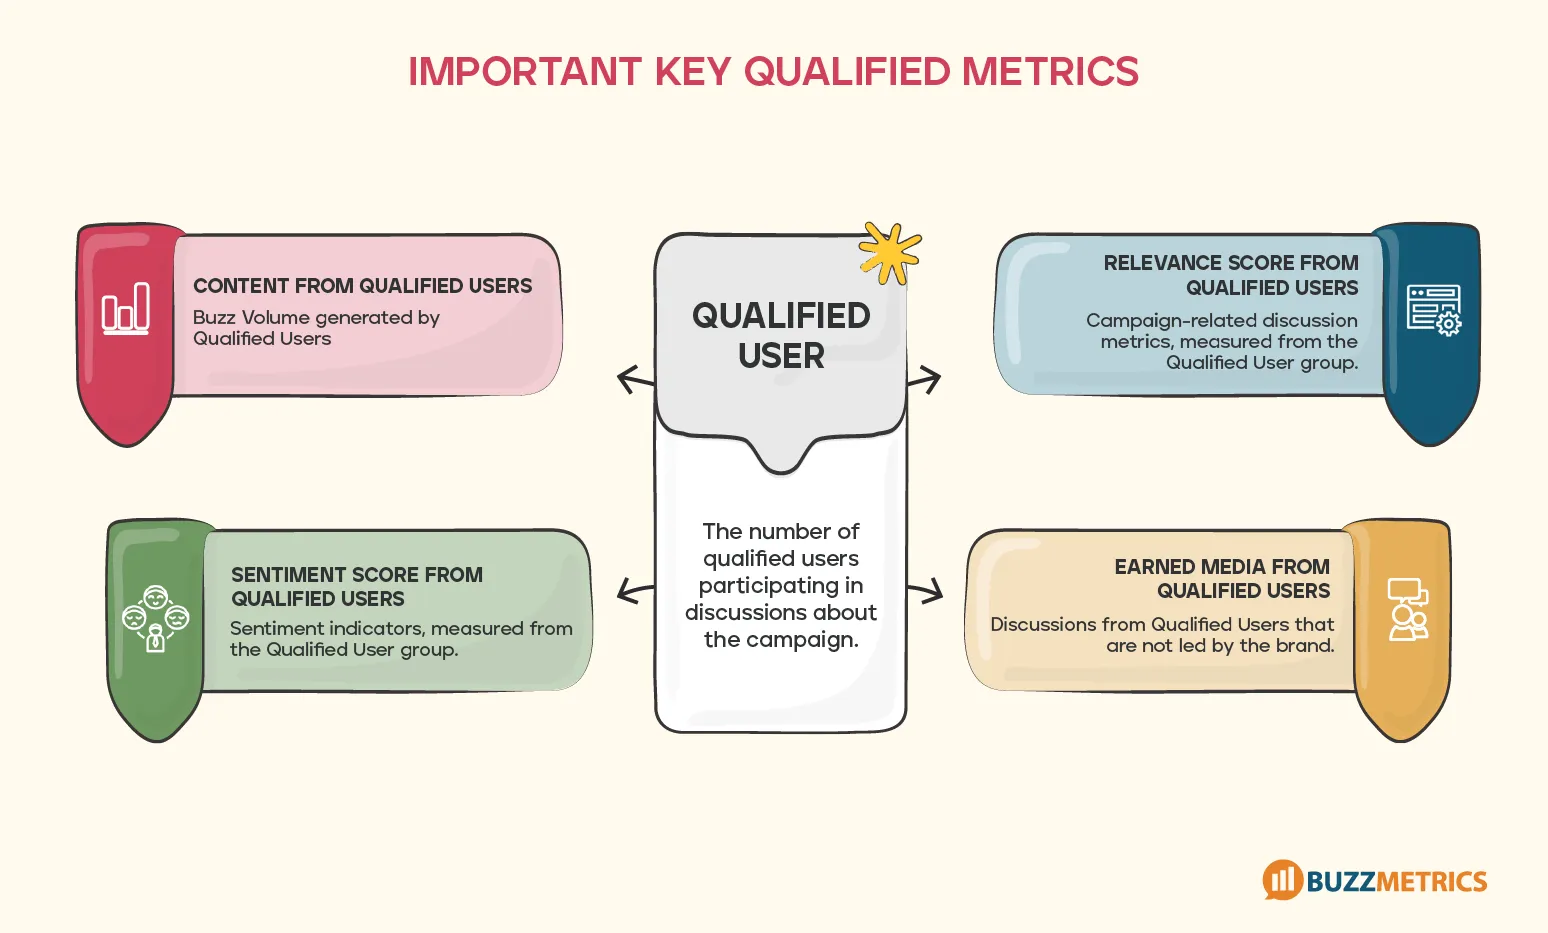
When Qualified User is used as the foundation, the following key metrics are directly impacted:
So how have Qualified Metrics tangibly influenced campaign evaluation? Looking at the long-term picture across the first eight months of 2025, since Qualified Metrics were applied to the BSI Top 10 Campaigns ranking, the marketing landscape has become more dynamic than ever. New categories and smaller brands with creative approaches have appeared in the BSI Top10. This provides well-deserved recognition for campaigns that generate "real engagement, real buzz."
It encourages Agencies and Brands to focus on creative content rather than an arms race based on "artificial volume." This is also the basis for Buzzmetrics to continue applying Qualified Metrics to evaluate Tet 2026 campaigns. It can be said that Qualified Metrics are no longer an option but have become a mandatory requirement in social media conversation analysis.
Although Tet 2026 campaigns have only reached the halfway mark, the market is already vibrant and highly creative. With rapid growth in both campaign volume and discussion intensity, evaluation based on Qualified Metrics is no longer a luxury-it is a necessity. Qualified Metrics not only help protect brand value but also enable real-time campaign optimization. Don’t let inflated numbers drown out the authentic voice of real users.
.png)
In the banking industry—where brand trust, digital experience, and the speed of information diffusion play a critical role in building and sustaining customer loyalty—social media data should not be leveraged only when a crisis occurs. On the contrary, social data continuously and directly reflects the needs, expectations, and “pain points” of financial service users, ranging from service fees and transaction processes to digital platform experiences and expectations for new banking features. When systematically analyzed, insights derived from social listening become a strategic input for banks to inform product development, optimize the customer journey, and fine-tune communication strategies in line with market context and evolving consumer behavior. Therefore, the key question is no longer whether banks need social listening, but rather how millions of social conversations can be transformed into timely, focused decisions with measurable business impact.
Social Media Research is a form of market research based on naturally occurring user discussions across digital environments, including social networks, forums, blogs, review platforms, and online news outlets. Rather than relying on predefined questionnaires or scripted research scenarios, Social Media Research enables banks to directly observe how customers express their needs, emotions, and viewpoints in real-life contexts—providing an authentic reflection of how financial products and services are experienced in everyday life.
With its advantages in broad data coverage and rapid updates, Social Media Research allows banks to quickly identify shifts in customer sentiment following new product launches, policy adjustments, or when facing sensitive issues related to brand trust and reputation. When combined with transaction data—which shows what customers are doing—insights from social data add a critical layer of understanding around what customers are thinking and how they feel. This complementary perspective forms an essential foundation for banks not only to manage emerging issues, but also to proactively uncover insights that inform product development and communication strategies.
In the banking industry, product development is inherently complex. Customer needs are highly fragmented, product lifecycles are long, and many decisions still rely heavily on internal data or periodic surveys. While these data sources are effective in reviewing past behaviors, they are often insufficient for identifying emerging needs at an early stage. This is precisely the gap that Social Media Research helps to address—by capturing early signals of new customer expectations and interests from social conversations, before they become visible in business performance reports.
Looking more broadly across the financial services sector, transaction fees are the most frequently mentioned criterion (38%) when customers choose securities products, followed by transaction fee exemptions (14.7%). This high sensitivity to cost—rather than brand credibility—in the context of frequent transactions represents a critical insight for designing product packages that effectively attract new users.

Building on this insight, VNDIRECT launched a free equity trading program for new account holders from July 21, 2025 to October 21, 2025, positioning it as a time-bound incentive to stimulate account openings and encourage initial usage. In contrast, DNSE adopted a lifetime free trading strategy. These two initiatives illustrate how brands can leverage social insights to adjust product structures and pricing policies—rather than merely optimizing communication messages—thereby directly addressing the core “pain points” that users care about most.
By analyzing user discussion themes, brands can identify the most relevant communication messages and select the most effective channels to reach each target audience segment. Once a campaign is launched, Social Media Research continues to play a measurement and feedback role, enabling content and communication teams to continuously optimize performance—by adjusting content formats, refining supporting messages, and reallocating budgets based on actual effectiveness.
As a result, communication efforts go beyond simply increasing reach. They enhance impact, gradually transforming consumer perception into action—moving audiences from awareness and consideration to actual usage decisions.
Learn more about the Insight for Planning Framework—a strategic framework that helps brands transform social media data into clear communication directions and actionable initiatives across each stage of the consumer journey—here: LINK
In the financial and banking industry, crises rarely begin with an official press release. More often, they emerge from scattered discussions on social media—such as complaints about application errors, suspicions of fraud, or inconsistent service experiences. Real-time monitoring of social discussions enables banks to detect early “warning signals” before issues escalate and spread widely.
More importantly, analyzing discussion volume, diffusion speed, and emotional sentiment allows banks to assess the severity of an issue—distinguishing between isolated feedback that can be handled by customer service teams and risks that may escalate into full-scale crises. This approach enables banks to respond in a timely and focused manner, rather than reacting passively once public sentiment has already intensified.
Read more to explore how communication crises unfold on social media here: LINK
Social Media Research enables banks to continuously monitor brand “health” through key indicators such as discussion volume, sentiment, share of voice versus competitors, and shifts in discussion topics over time. Beyond reflecting brand perception from the consumer’s perspective, these data also allow banks to contextualize their performance within the broader industry—identifying emerging trends, saturated topics, and which brands are leading the conversation, as well as why.
When tracked on a regular basis, social listening becomes a flexible form of industry research, helping banks proactively identify opportunities and risks, and adjust brand strategies based on real market dynamics—rather than relying solely on annual summary reports.
As discussed above, Social Media Research not only helps banks determine what to say and who to speak to, but can also guide the entire communication strategy—from platform selection and execution formats to how the brand positions itself within consumers’ cultural lives. Techcombank’s partnership with the program Anh Trai Vượt Ngàn Chông Gai serves as a representative example of how banks can leverage social insights to design a sponsorship strategy that goes beyond the singular objective of increasing reach.
From a content perspective, Anh Trai Vượt Ngàn Chông Gai recorded a clear surge in discussion volume from its early episodes, with discussion peaks centered around performances that demonstrated strong social media shareability—most notably the “Trống Cơm” mashup. The program’s approach to reinterpreting traditional cultural elements in a polished, artistically rich manner, combined with the participation of veteran artists, enabled it to effectively attract a mature audience segment—individuals with stable financial foundations who prioritize meaningful and high-quality entertainment experiences. This audience segment also aligns closely with Techcombank’s strategic target customers.

What set Techcombank apart from other sponsoring brands was not the frequency of its appearances but the degree to which the brand aligned with consumer insights. Rather than remaining on the sidelines as a conventional “sponsor,” Techcombank took an active role by organizing live concerts, extending the audience experience beyond the screen and into real life. At the same time, brand messages were not delivered through overt advertising but instead conveyed organically through the program’s artists - figures who already held strong influence within their fan communities, allowing the content to be received more naturally. In parallel, the concept of “Automatic Earning” was simplified and consistently reinforced, eventually even becoming a form of slang within the target audience group. By translating an otherwise abstract financial feature into everyday language that was easy to understand and repeat, Techcombank was able to move beyond awareness and positive sentiment, gradually converting affinity for the program into tangible financial behaviors.

Overall, real-world practices in the financial and banking industry demonstrate that social listening is no longer limited to crisis management. Instead, it is increasingly becoming a critical foundation that enables brands to develop products, plan communications, build communities, and shape long-term brand positioning.
Trong bối cảnh thị trường bão hòa thông tin, thương hiệu có nhiều dữ liệu hơn bao giờ hết nhưng lại ít câu trả lời rõ ràng hơn. Nếu không có một phương pháp bài bản, insight giá trị sẽ bị nhấn chìm giữa “biển dữ liệu”, khiến chiến dịch rời rạc và ngân sách bị lãng phí. Insight for Planning Framework của Buzzmetrics được xây dựng trên nền tảng Qualified Metrics, giúp biến dữ liệu mạng xã hội & TMĐT thành lộ trình marketing 3 bước: từ xác định insight người dùng thật, phát triển Big Idea đến triển khai & tối ưu chiến dịch với kết quả đo lường được.
Insight for Planning Framework không đơn thuần là một chuỗi bước thực thi, mà là một hệ thống tư duy toàn diện, giúp marketer:
Được xây dựng trên nền tảng bộ chỉ số Qualified Metrics, framework này tạo thành quy trình ba bước rõ ràng:

Mục tiêu của giai đoạn này không chỉ là thu thập dữ liệu, mà là xác định đúng “điểm đau” và cơ hội thị trường trước khi bắt tay vào bất cứ hoạt động nào.
Từ insight đã “mài giũa”, giai đoạn Planning tập trung vào việc chuyển dữ liệu thành một Big Idea rõ ràng và các trụ cột nội dung (Key Content Pillar) xuyên suốt.
Khi ý tưởng đã rõ, việc triển khai và liên tục tối ưu là chìa khóa để biến kế hoạch thành kết quả thực tế.

Thay vì bị lạc lối trong hàng ngàn bình luận seeding trên mạng xã hội, framework sẽ phân tách thảo luận thành các nhóm đối tượng khác nhau, tập trung vào nhóm Qualified Users. Từ đó, marketer có thể trả lời câu hỏi then chốt:
Khi đã biết chính xác những vấn đề, nhu cầu và kênh tiếp cận quan trọng (white space), thương hiệu sẽ không còn tốn kém vào những hoạt động thử sai không cần thiết. Mỗi đồng ngân sách đều được đầu tư vào đúng “khoảng trống” mà người dùng thật quan tâm nhất.
Khi chiến lược được xây dựng dựa trên insight chân thật và đo lường bằng các chỉ số chất lượng, kết quả không chỉ là một đợt “buzz” nhất thời mà còn là tác động lâu dài: mức độ gắn kết, sự yêu thích thương hiệu và hành động mua hàng thực tế đều được cải thiện rõ rệt.
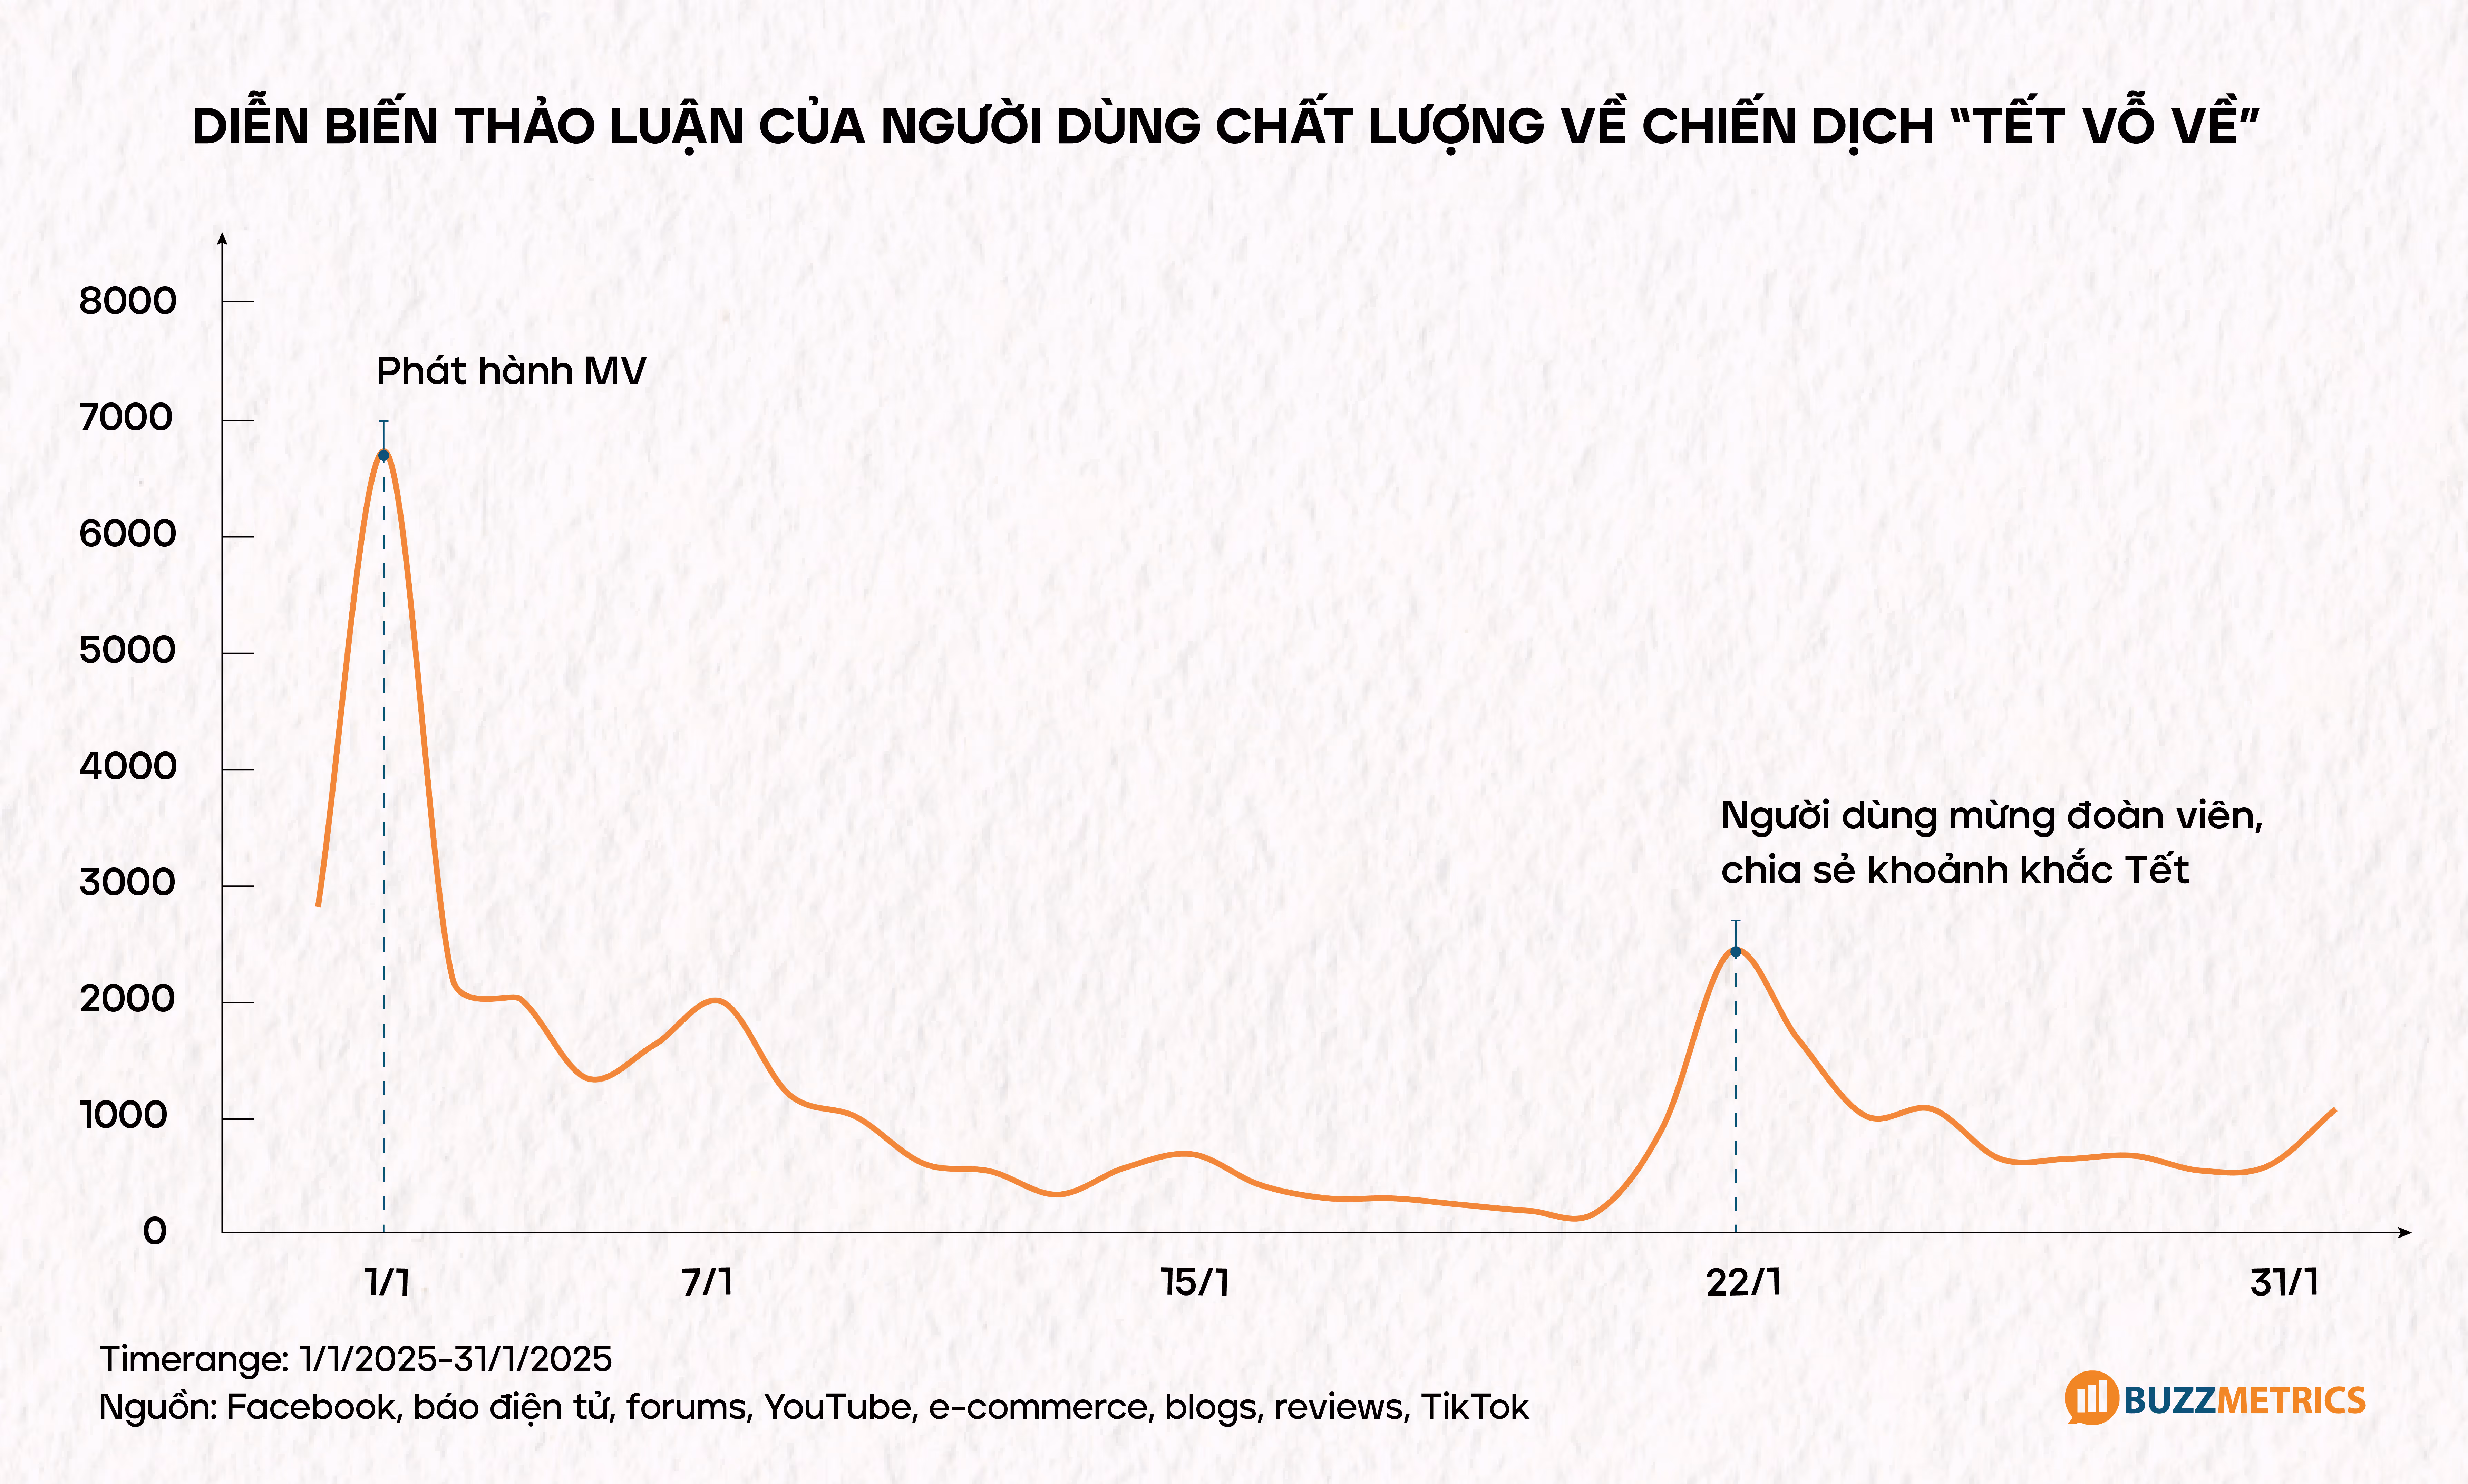
“Tết Vỗ Về” không chỉ dẫn đầu BXH BSI Top10 mới mà còn ghi nhận tỷ lệ Content from Qualified Users/Total Buzz cao nhất, và thảo luận về chiến dịch tiếp tục sôi nổi, ngay cả khi hoạt động chính đã kết thúc, thể hiện chiều sâu tác động vượt trội so với các chiến dịch chỉ “chạy đua buzz.” Kết quả này xuất phát từ việc Lifebuoy áp dụng chặt chẽ ba bước của Framework Planning for Insight:
Ở giai đoạn này, Lifebuoy đã chắt lọc insight chuyển hóa thành Big Idea, Content Pillars để đảm bảo chiến dịch vừa nhất quán, vừa khác biệt.
Vỗ: thấu cảm áp lực và khó khăn của năm cũ.
Về: khao khát bình yên, sum họp bên người thân.
Vỗ Về: khoảnh khắc chữa lành trong vòng tay gia đình.
Mỗi pillar vận hành đồng bộ trên toàn bộ assets (teaser, MV, UGC…), giúp thông điệp duy trì mạch cảm xúc từ giai đoạn khơi gợi đến khi kích hoạt hành động.

Nhờ đi theo đúng framework ba bước Insight → Planning → Launch & Optimization, “Tết Vỗ Về” không chỉ tạo nên “buzz” mà còn chạm đến cảm xúc thật của người tiêu dùng, minh chứng cho sức mạnh của việc lập kế hoạch marketing dựa trên insight chất lượng.
Insight for Planning Framework không chỉ giúp marketer thoát khỏi mê cung của những tactics rời rạc, mà còn mang tới một lộ trình rõ ràng: từ khai thác insight thật, chuyển hóa thành Big Idea sâu sắc, đến ra mắt và tối ưu chiến dịch dựa trên dữ liệu chất lượng. Khi áp dụng đúng ba bước này, thương hiệu sẽ tạo ra tác động bền vững, gia tăng gắn kết với người dùng thật và tối ưu ngân sách một cách hiệu quả.

In the process of implementing communication campaigns, many brands tend to apply previously successful formulas or rely on market observations to quickly implement tactics such as advocacy, creating debates, or mini-games... in order to achieve goals related to coverage or discussion volume.
This leads marketers to struggle with the question: Which content, format, or tactics will attract users, while overlooking the issue of: 'What is the insight? How can we extract this insight and implement it into relevant activities?'
However, continuing to experiment with different tactics to achieve broader coverage without revisiting the initial insight may not yield the desired results.
Currently, it is not difficult to come across social media campaigns using tactics to steer discussions, increase engagement, or simply boost the 'buzz' for a brand. However, these tactics are gradually becoming saturated, causing not only users to struggle in identifying real people from 'fake' interactions, but also the brands themselves to get lost in this maze. From mini-games with thousands of discussions tagging friends and commenting positively for the brand just to receive rewards, to seeded comments on KOL profiles or comments like '.' to receive inbox messages. Together, these tactics create a context where social media is flooded with discussions not coming from real users, or discussions that do not provide valuable insights or analysis for the brand.
Starting from early 2025, Buzzmetrics has updated its measurement method and launched a set of three new metrics.

a. Qualified Users:
The metric reflects the amount of quality users participating in discussions about the campaign/ event/ KOLs/ TV programs.
Quality users are those who do not show any abnormal patterns in content creation frequency or content duplication on social media. This metric will be processed automatically based on algorithms developed by Buzzmetrics. Qualified Users is an improvement of the Audience Score metric from the BSI Top10 Ranking of 2023.
*Audience Score: As the majority of Vietnamese people now have social media accounts, the presence of a large number of newly created accounts participating in brand-related discussions does not reflect the genuine appeal to natural users. This metric is designed to assess the attractiveness of a commercial campaign to natural users, compared to 'fans' who create fake accounts to support a brand or a celebrity.
b. Content from Qualified Users:
The metric reflects the volume of discussions generated by quality users. Content from Qualified Users is an improvement of the Diversity Score metric.
*Diversity Score: The metric reflects the level of diversity in the content of discussions on social media. As social media represents a society with diverse colors, personalities, and value systems, natural social media users will have varied responses with different opinions and stories. This metric aims to evaluate the natural engagement of a commercial campaign with social media users.
c. Social Advocator:
Social Advocator is a term used to refer to quality users on social media, those who not only create positive content related to the brand but also have influence in spreading the message and building the brand image in a natural and trustworthy way. They can be loyal customers, company employees, or individuals with a small but influential presence, possessing high engagement levels and strong personal relationships with their community.
d. Overview of Social Media Discussions Across Three Layers:

The set of metrics helps segment discussions from different user groups, thereby focusing on answering two main questions:
a. Extracting Insights from Real Users:

From July 2023 to June 2024, the powdered milk industry recorded 13.4 million discussions on social media. However, the majority of this content came from unidentified accounts, including fanpages, groups, or users with abnormal behaviors, accounting for 73.5% of the total discussions. Only 26.5% of the discussions came from real users (Qualified Users) – those with natural behaviors and valuable insights for analysis.
This means that if the analysis were conducted on the total volume of discussions rather than on the real user group, the results would undoubtedly be biased by activities and other groups.
The mechanism of the Qualified Metrics ensures that the communication strategy is built on real consumer insights, not from advocacy activities or clone accounts.
b. Application in Campaign Measurement:
The Top 10 Tết Campaign Ranking is a clear example that highlights the difference between two methods of measuring campaign effectiveness: one based on Total Buzz (total discussion volume), and the other based on Content from Qualified Users, which refers to content from real users with natural interactions and true value in spreading the message.

For example, the OMO – Kiên Trì Là Dì Thành Công campaign ranked first in the table based on total buzz with over 827,000 discussions. However, when evaluating based on the Content from Qualified Users metric, the campaign dropped to fourth place with only around 18,683 pieces of content – equivalent to approximately 2.3% of content from qualified users compared to Total Buzz.
Campaign Lifebuoy – Tết Vỗ Về ranked eighth in Total Buzz (36,109 buzz), but rose to second place overall when measured by Content from Qualified Users. This highlights the natural and emotional connection the campaign created, generating higher-quality content compared to others.
When combining these three metrics with the new formula of the BXH BSI Top10 phiên bản 2025, we gain a new perspective on which campaigns truly engage real users in meaningful discussions:

By shifting from evaluating campaigns solely based on 'buzz' to focusing on 'quality', brands can gain a deeper understanding of what truly drives sustainable impact. This is exactly why Buzzmetrics' new set of metrics was introduced: to offer a more insightful, realistic, and effective perspective on communication.
From analyzing metrics such as Qualified Users, Content from Qualified Users, and Social Advocators to the actual effectiveness of the 'Tết Vỗ Về' campaign, Buzzmetrics has developed a framework for building deeper and more effective campaigns – a structured system that helps brands implement communication campaigns through a clear three-step process:

Social Media KPIs are key performance indicators that measure a brand's effectiveness on social media. These metrics play a crucial role throughout an entire campaign—from the planning phase to post-campaign evaluation. With years of experience in market research and advising top brands, Buzzmetrics has identified four key steps in building Social Media KPIs for successful campaigns: (1) Defining campaign objectives – Establishing clear goals for what the campaign aims to achieve. (2) Understanding the significance of each metric – Knowing what each KPI represents and how it reflects performance. (3) Aligning campaign goals with measurement metrics – Ensuring that the selected KPIs accurately track progress toward strategic objectives. (4) Avoiding common misconceptions when setting KPIs – Recognizing and addressing potential misinterpretations to ensure accurate measurement.
In this article, Buzzmetrics will highlight key considerations for each of these steps. This will also be the first in a series of articles discussing the future of measurement in Social Listening.

Building a set of measurement metrics for a campaign must always start with clearly defined objectives. Each campaign serves a different purpose, and there are various ways to categorize these objectives.
In the context of social media measurement, one effective way to classify objectives is by aligning them with the customer journey, corresponding to the three stages of the marketing funnel:

As mentioned earlier, a campaign is evaluated based on both breadth (awareness) and depth (discussion quality). Social media metrics generally fall into one of these two categories.
Metrics for Awareness
Metrics for Discussion Quality
For a detailed breakdown of these metrics, you can refer [here].
However, as communication campaigns evolve, so do Social Listening measurement methods. Beyond the traditional metrics above, new indicators have emerged to provide a more precise assessment of campaign performance. In the near future, Buzzmetrics is launching new measurement frameworks focusing on the authenticity of campaign discussions.
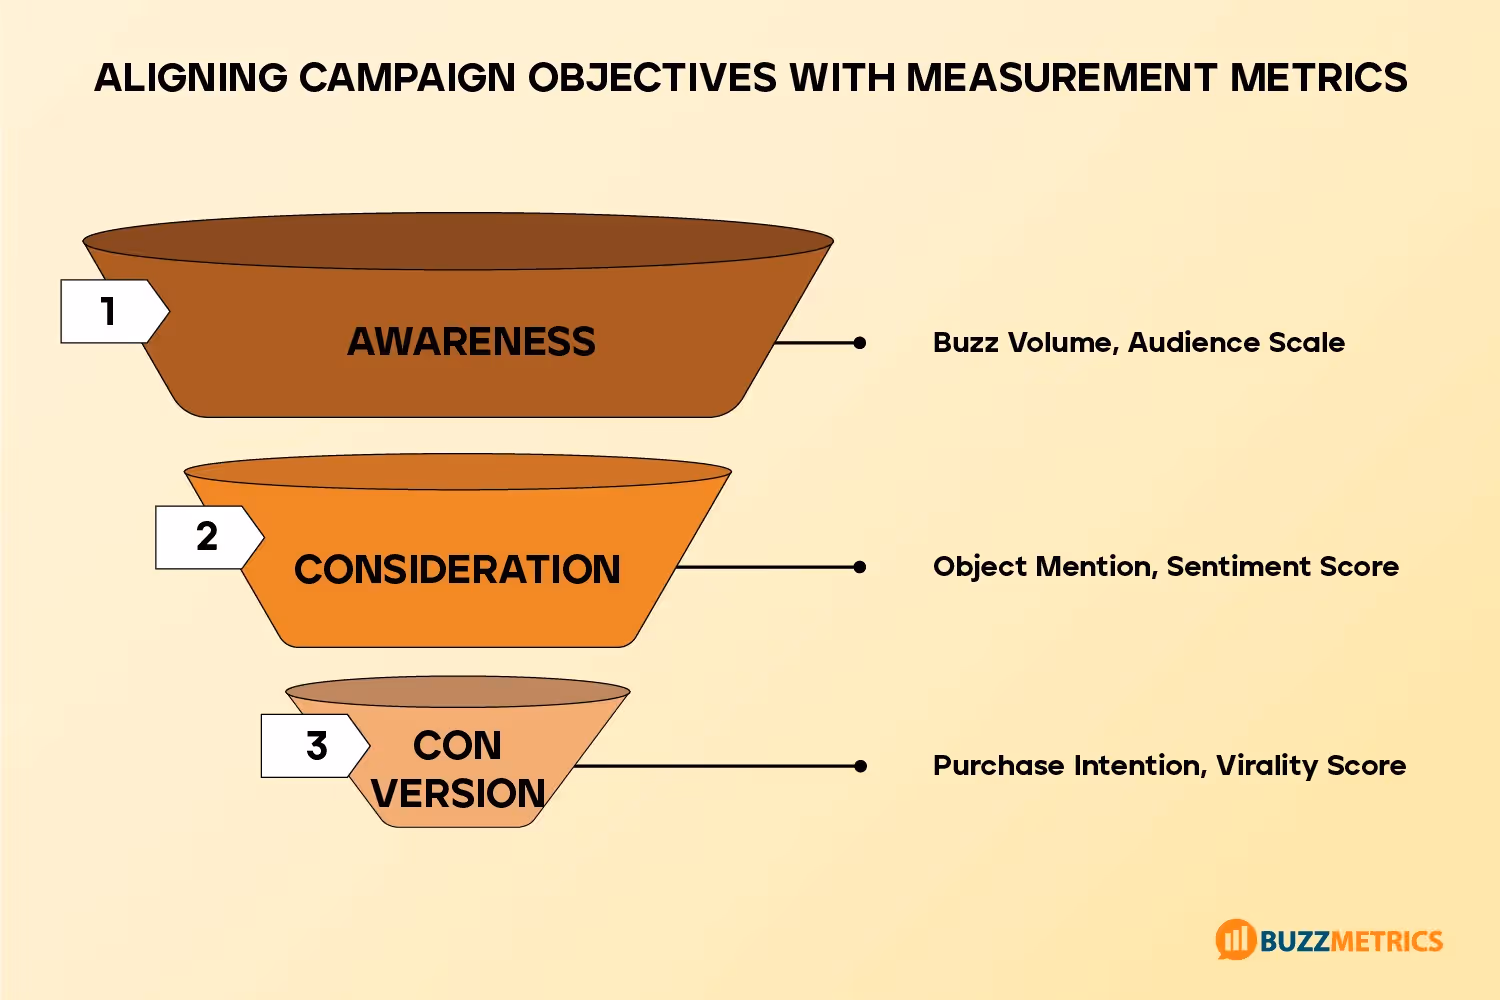
Once campaign objectives and key metrics are clearly defined, the next step is aligning them to create a complete KPI framework. Below is a basic framework for mapping metrics to each stage of the marketing funnel:
(1) Is virality the only goal?
A successful campaign is not necessarily one that generates the highest number of discussions—it’s one that achieves the brand’s intended objectives. Over-focusing on the scale of discussions (Buzz Volume) may lead brands to overlook their original goals.
(2) Should brands track as many metrics as possible?
In reality, tracking an extensive set of KPIs is nearly impossible and highly inefficient. Instead, brands must carefully select the most relevant metrics—those that directly reflect the relationship between campaign objectives and execution. Measuring too many KPIs can drain resources without delivering actionable insights.
(3) Are all interactions beneficial?
While increased engagement can boost a campaign’s reach, brands must also assess the nature of interactions—whether they are positive or negative, and whether they come from real users or bot accounts. In other words, a well-structured Social Media KPI framework must incorporate qualitative aspects to ensure an accurate and objective evaluation.
This principle is also applied in Buzzmetrics’ BSI Top10 Rankings, which assess the most influential campaigns, KOLs, events, and shows on social media based on a holistic measurement approach.
(1) Establishing clear Social Media KPIs not only helps brands measure performance but also enables them to optimize strategies and achieve desired outcomes. Brands should ensure that selected KPIs align with business objectives and provide actionable insights, rather than just chasing vanity metrics.
(2) As Social Media Marketing evolves, KPI frameworks will no longer be purely objective-driven but will also be deeply tied to campaign insights. This shift presents a major challenge that brands must address to refine their measurement strategies in the future.
For the first time, the BSI Top10 Events ranking for January 2024 recorded that 6 out of 10 most influential and prominent events on social media were award ceremonies. According to Buzzmetrics' observation, this is not a random phenomenon but reflects underlying factors that mirror the discourse on social media. In this article, Buzzmetrics will analyze the factors contributing to the success of award ceremonies in January 2024.
From 2018 to 2021, the BSI Top10 Events ranking for January typically recorded the presence of 1-2 award ceremonies. However, in 2022 and 2023, award ceremonies completely disappeared from the BSI Top10 Events rankings. By January 2024, the BSI Top10 Events ranking noted: For the first time, 6 out of the top 10 most influential events on social media were award ceremonies. Alongside familiar programs such as the WeChoice Awards, Green Wave Awards, and Golden Apricot Blossom Awards, there were three events making their debut appearances: Face Of The Year Awards 2023, the Star of the Year 2023 Awards Ceremony, and the 28th Asian Television Awards Gala.
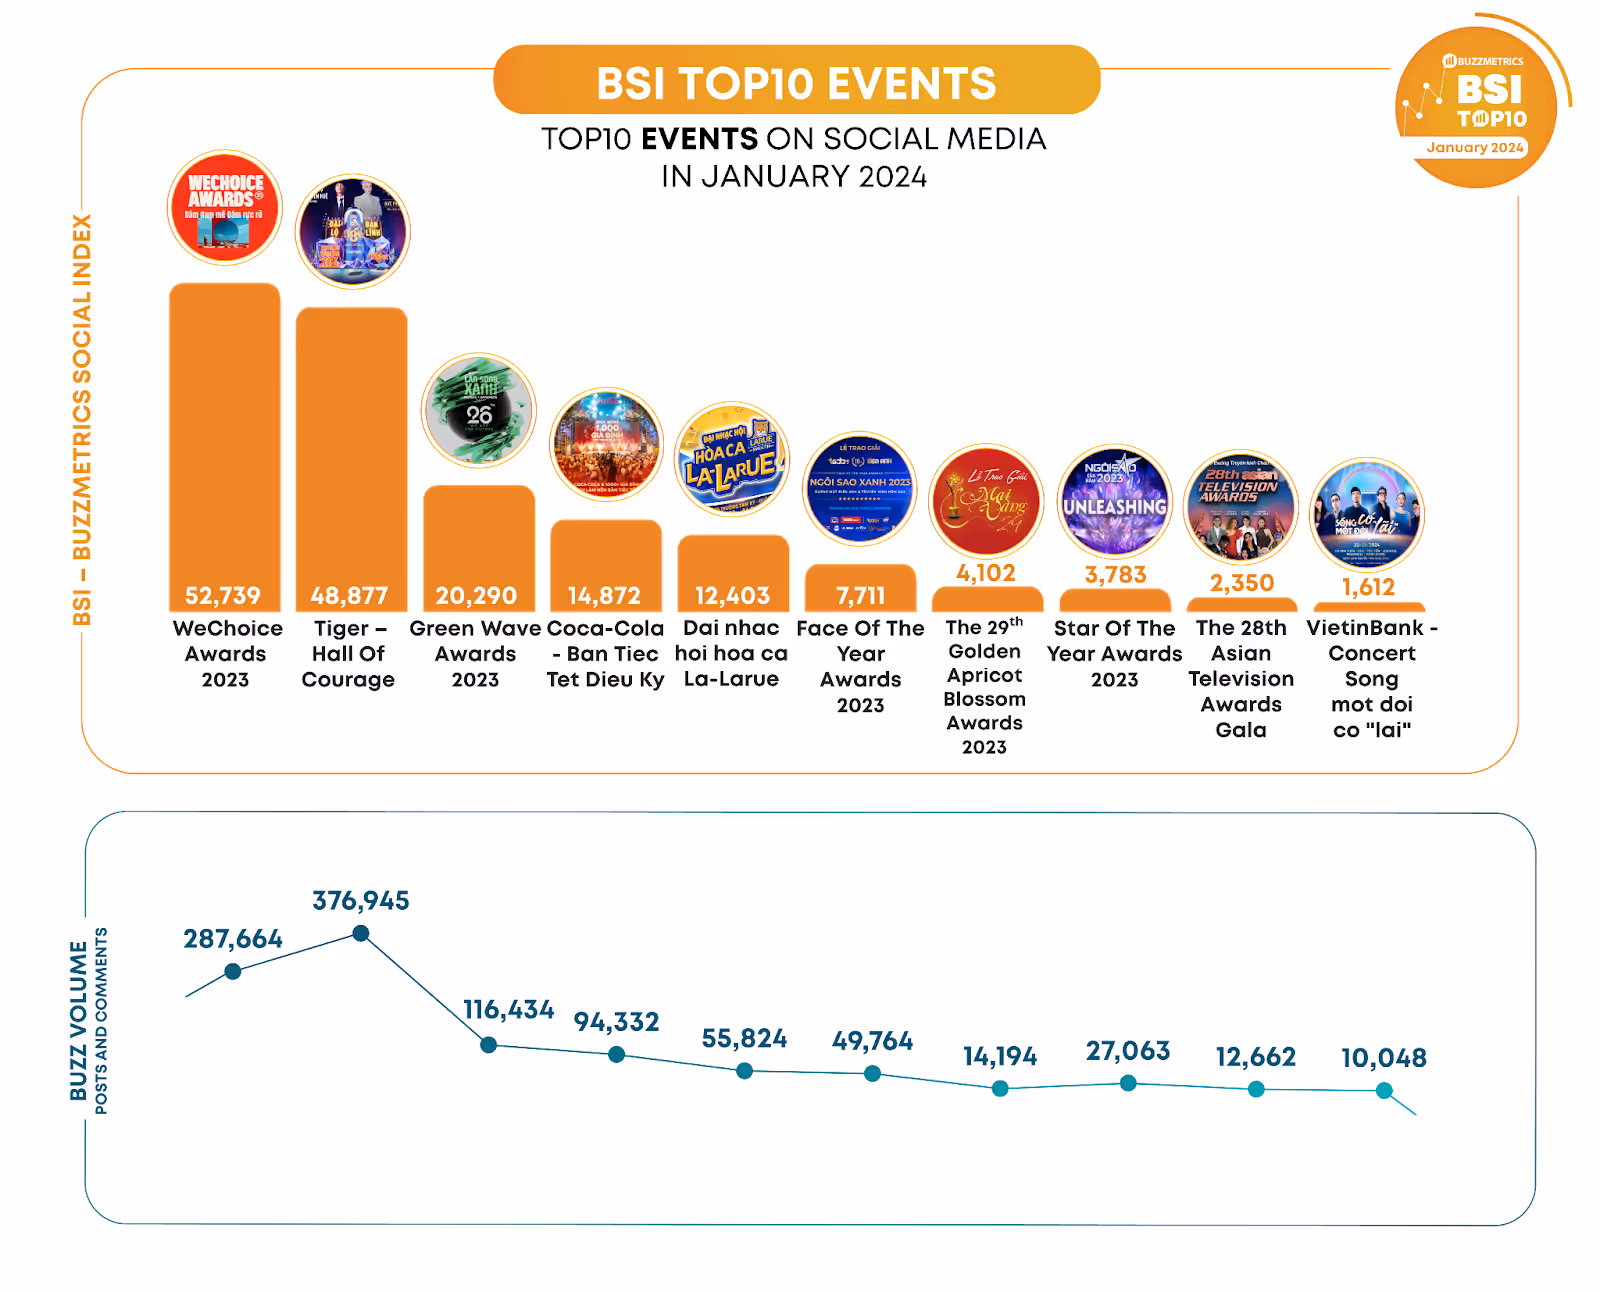
According to Buzzmetrics data, Golden Apricot Blossom Awards appeared in the BSI Top10 ranking two years ago. As for the Green Wave Awards, it was absent from the rankings four years ago before returning to the list. WeChoice Awards had consistently made appearances and achieved high rankings in the BSI Top10 Events before pausing for two years due to the pandemic. In this comeback, all three events have generated significant buzz on social media: WeChoice Awards 2023 with nearly 300,000 discussions, the Green Wave with 100,000 discussions, and Golden Apricot Blossom with almost 15,000 discussions. The other three award ceremonies also generated over 10,000 discussions each. Notably, the Audience Score and Diversity Score of all six award ceremonies are quite high (above 0.8). These metrics indicate that the events are being genuinely engaged with by users and have good diversity in discussions (See detailed data in the BSI Top10 Events ranking for January 2024).

So what contributed to the success of these award ceremonies? According to Buzzmetrics' observations, this is not a random phenomenon but reflects underlying factors that mirror the discourse on social media. In this article, Buzzmetrics will analyze the factors contributing to the success of the award ceremonies in January 2024.
The WeChoice Awards 2023 and Green Wave Awards 2023 - two award ceremonies with the highest BSI score - have garnered notable recognition with Gen-Z faces. At Green Wave Awards, Phuong My Chi emerged as the Outstanding New Face, while Wren Evans was honored in both the Breakthrough Artist and Album of the Year categories. At the WeChoice Awards, MCK stood out by winning in multiple entertainment categories and making it into the Top 10 Inspirational Figures, alongside other Gen-Z such as HIEUTHUHAI and the communication team of the Hoa Lo Prison relic site. Additionally, the WeChoice Awards dedicated a whole group of categories to Gen-Z, such as Z-Slang - Phrase of the Year and Z-Face - Prominent Gen-Z Figure. These elements play a crucial role in attracting the attention of Gen-Z - a demographic that boasts a strong presence on social media.
Phuong My Chi, HIEUTHUHAI, Mono, and Double 2T - prominent Gen-Z figures at various award ceremonies - have also appeared in the BSI Top 10 Influencers ranking. Additionally, the participation of Tran Thanh and Den Vau has helped increase discussions around certain award ceremonies. A common characteristic of these two artists is their long-standing careers coupled with a strong presence on social media and a significant Gen-Z fanbase.
This year's award ceremonies have all been meticulously invested in various aspects of media, thereby creating influence on social media.
Media Channels: Most award ceremonies primarily utilize two main media channels: (1) websites - where important information and the spirit of the event are provided, and (2) Facebook fanpage - where news updates are posted, creating a bridge between users and the event.
Media timeline: The official award ceremonies typically take place from mid to late January. Media activities for the events usually begin 1-2 months prior and extend for a week after the conclusion of the award ceremonies.
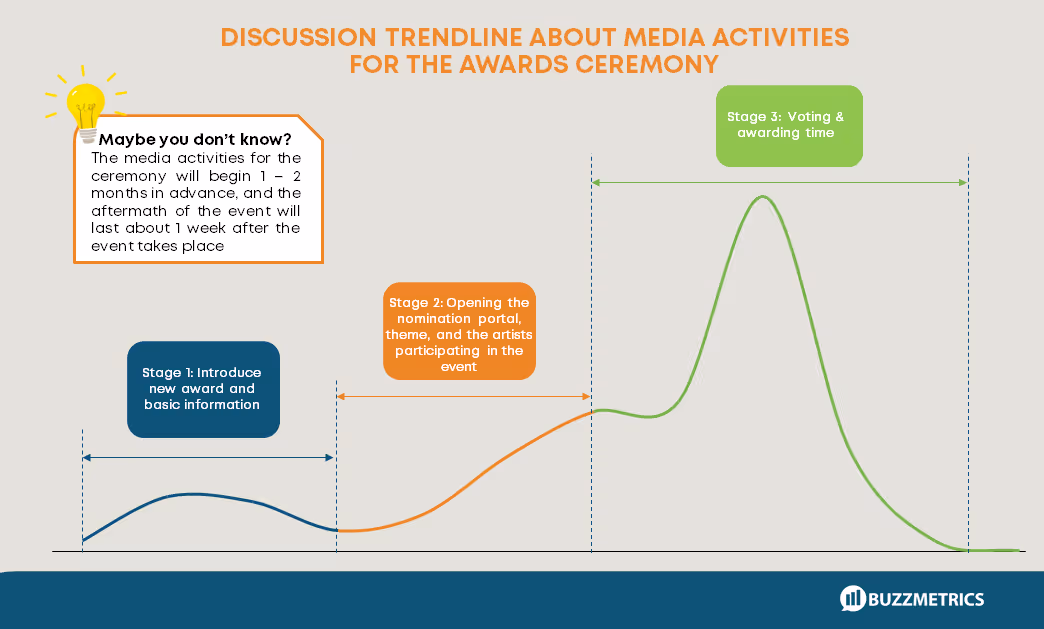
Frequency and Diversity of Information: At peak times, there are about 2-3 posts per day, covering various content perspectives: celebrity statements, program message analysis, award announcements, and memorable moments of the event. This strategy meets the informational needs of users and helps maintain the event's presence.
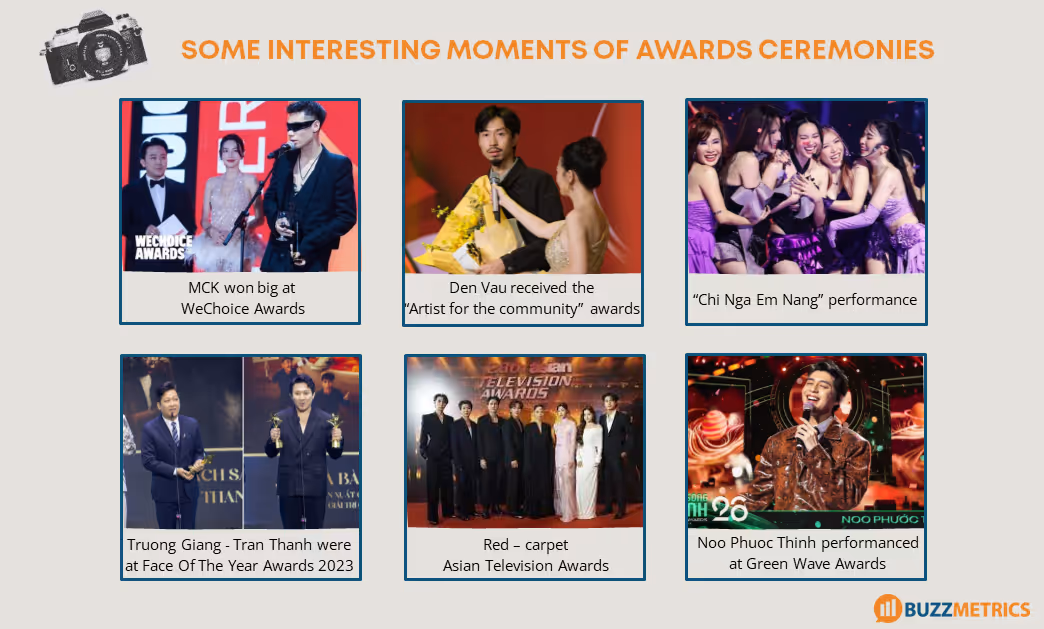
At every event, beyond the award-giving activities, there are viral moments that differentiate one event from another. Notable instances include:
As a year draws to a close, users tend to reflect on what has transpired throughout the year. In other words, "year-end recap" naturally becomes a focal point at the end of the year. This can be evidenced by Social Listening data: Buzzmetrics statistics show that the volume of discussions containing keyword groups related to year-end recap significantly increases from December.

In terms of Occasion-Based Marketing language, award ceremonies essentially serve as "recaps of a year in fields closely associated with the public," tapping into the most significant user concerns at a particular time.
In the context of social media development, the communication of award ceremonies has leveraged current affairs and social media platforms to open doors to connect with users, garnering their interest, anticipation, and excitement before, during, and after the event. In other words, merely tapping into the right interest isn't enough to create an impactful award ceremony on social media. It must be a harmonization of various factors, including the organizers' efforts in the digital transformation process.

Social Listening is a form of market research based on social media discussions, helping to analyze brand health, campaigns, special events, and more...
Along with the development of social networks, Social Listening is also growing in application capabilities. If in the past, Social Listening was only about collecting social media data, today data collection is only a part of Social Listening. Measuring buzz volume or sentiment is no longer the only function of Social Listening. In the context of this article, let's look at old questions through a new lens: What is social listening and what role does it play in social media marketing?
Social Listening is a form of market research that analyzes online user discussions across social media platforms. It involves the collection and analysis of conversations from various online platforms, including social media, forums, blogs, news sites, and review websites. Unlike traditional research methods, Social Listening works primarily with unstructured data, offering businesses real-time feedback from diverse users across different online platforms.
Typically, a Social Listening process follows these steps:
- Step 1: Build an analysis plan
Researchers begin by defining the context and research objectives, then set the key questions to be addressed.
- Step 2: Data collection
Using Social Listening tools, researchers gather data based on keywords from all social platforms, ensuring an accurate and comprehensive understanding of trends and industry data.
- Step 3: Data filtering and analysis
After collecting data, researchers filter out irrelevant or misleading information to ensure accuracy. Data is processed through AI systems and human verification to find potential insights.
- Step 4: Data visualization and reporting
Finally, the results are compiled into a complete report with visualized data for easier understanding and decision-making.
Social Listening data sources are not limited to major social media platforms like Facebook, Instagram, TikTok, or Threads. They also cover any medium that allows multi-way interaction, including forums, e-newspapers (comment sections), blogs, and e-commerce review sections.
(A) API Data Collection
This method connects Social Listening tools to the APIs (Application Programming Interfaces) of social networks to retrieve posts containing specific keywords.
- Advantages: Allows access to all data from the network, including personal pages.
- Disadvantages: API reliability may fluctuate, leading to incomplete or inconsistent data over time.
(B) Site Data Collection
This method involves accessing listed sites to collect data without disrupting the websites, either by manual or automatic data gathering processes.
- Advantages: Ensures 100% of data on the site is collected.
- Disadvantages: Certain issues, like site changes or blocking, may cause temporary data shortages.
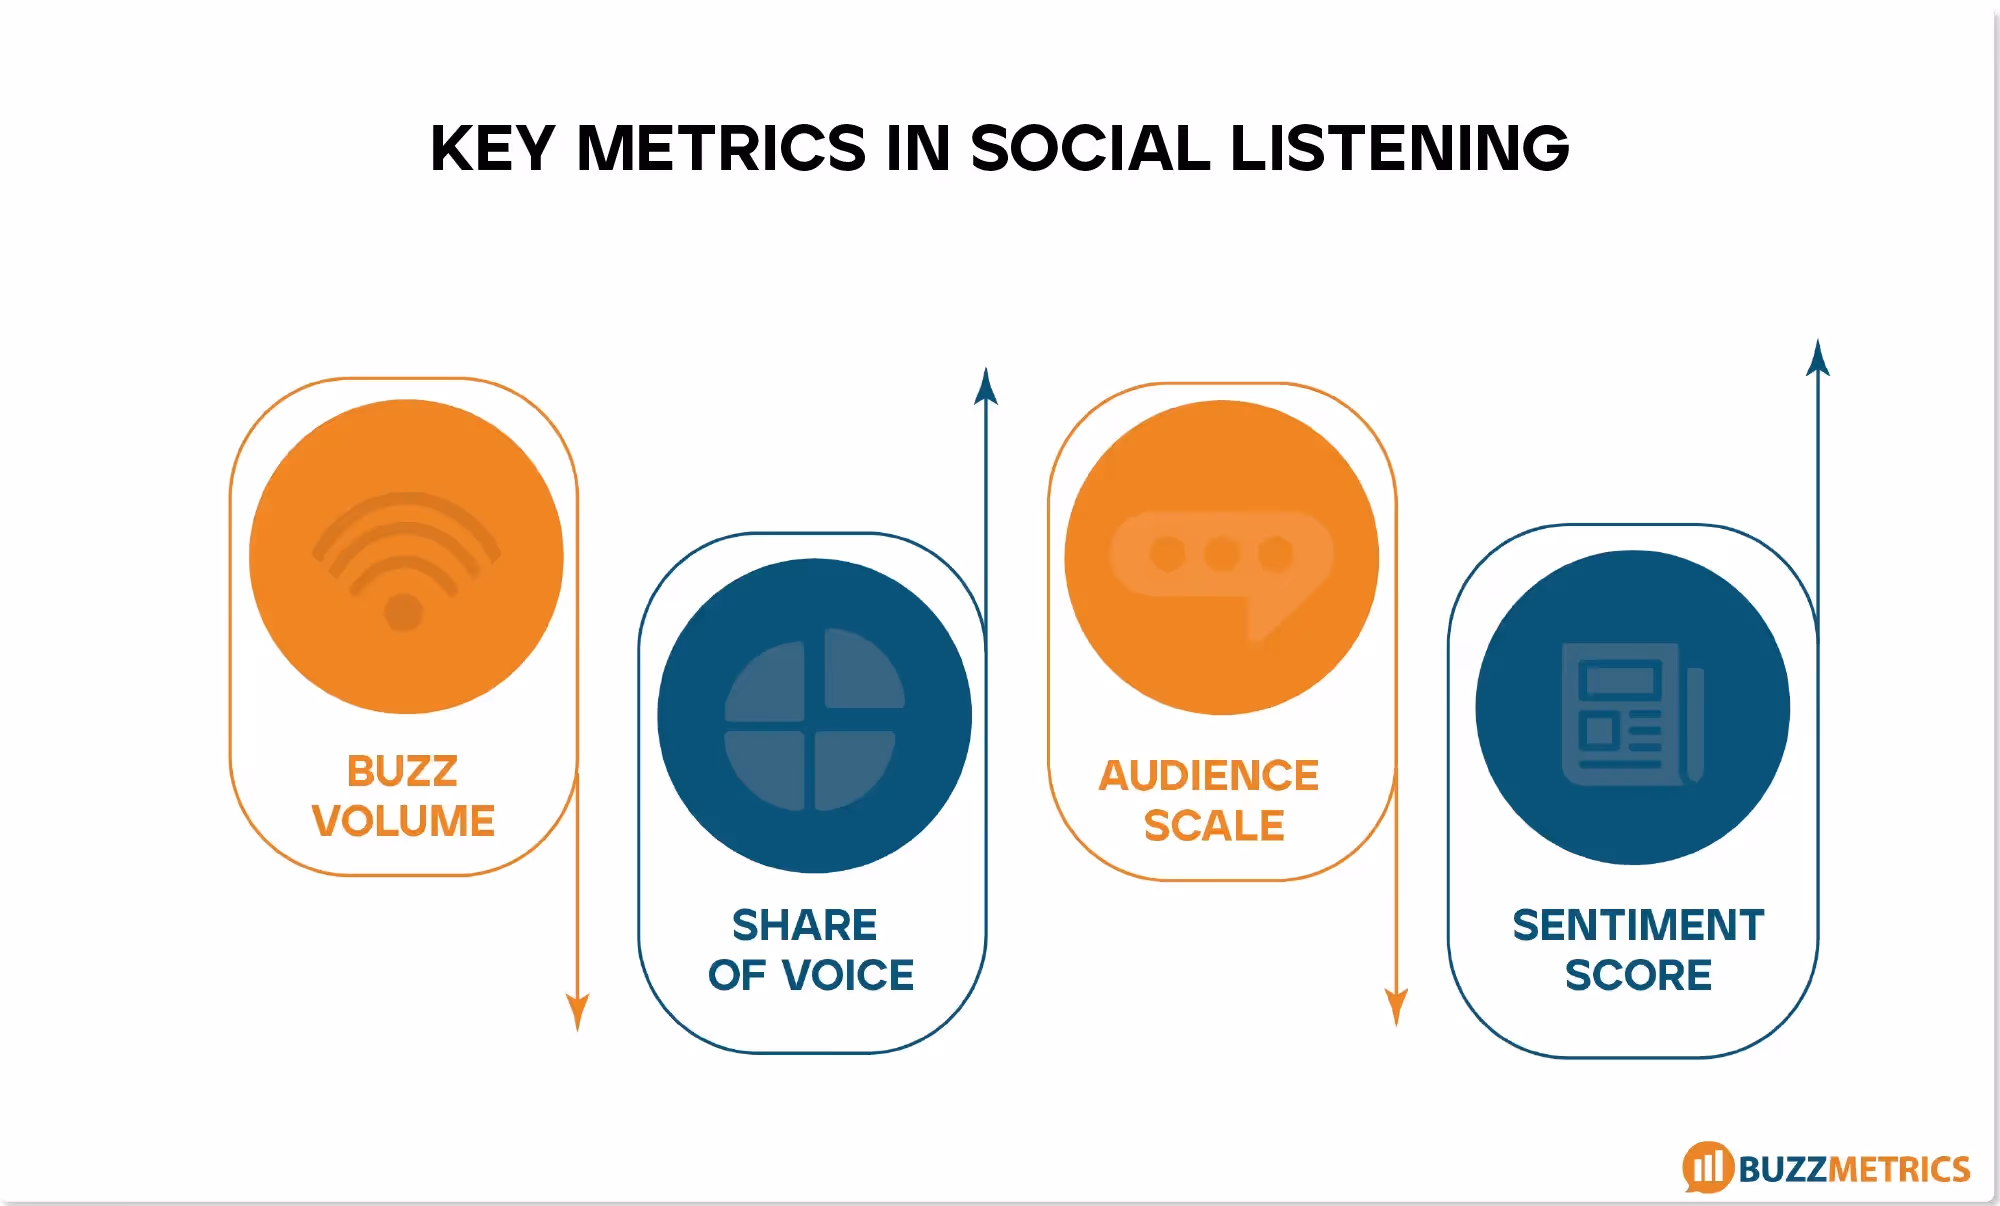
When conducting research via Social Listening, marketers should focus on key metrics to gain a comprehensive view of the research landscape and measure the effectiveness of their Social Media Marketing strategies:
- Buzz Volume: The number of discussions (posts, comments, or shares) about a specific topic.
- Share of Voice (SOV): Compares the discussion volume of a brand against competitors.
- Audience Scale: The number of individuals participating in discussions about a topic.
- Sentiment Score: Indicates users' emotions toward a topic, calculated by comparing positive and negative discussions.
Initially, Social Listening was seen by many marketers as a purely measurement tool, providing basic metrics about campaigns or brands in comparison with competitors (such as discussion volume, participant count, sentiment scores, etc.). However, over time, social media has expanded significantly in scale. Users have become more familiar with Digital Transformation, sharing more than ever, and social media trends are emerging increasingly. As a result, the scope of social media data has broadened, offering a wealth of potential information to support Social Media Marketing strategies. Consequently, Social Listening has also evolved to gather data across various platforms and meet diverse research needs from marketers.
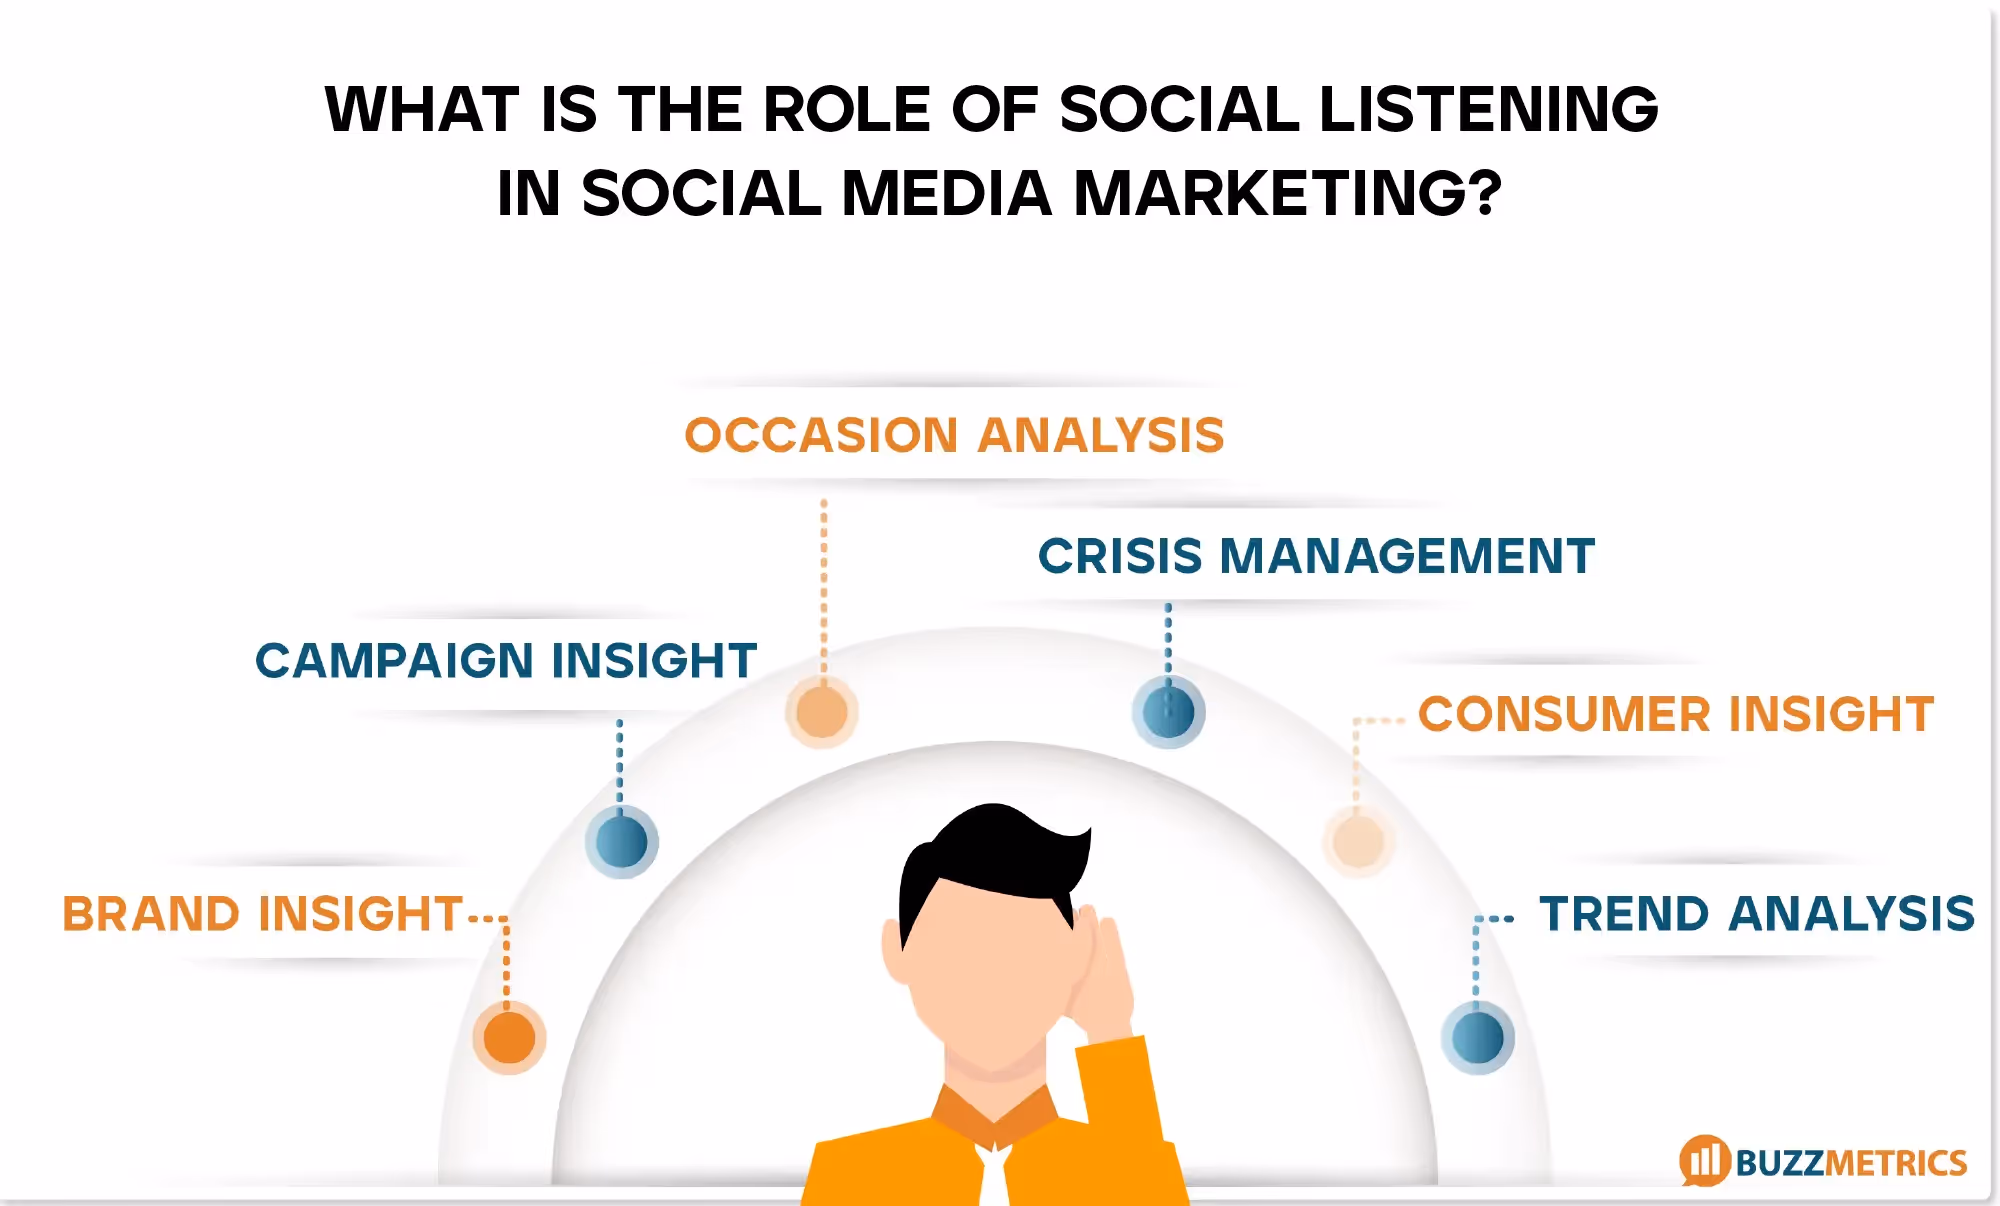
For each research focus, marketers can apply Social Listening to a range of different areas. Typically, marketers can use Social Listening for three main research directions: (1) Insight Understanding, (2) Campaign Tracking, (3) Crisis Management.
This research can provide a comprehensive overview of a specific industry, including e-commerce performance, brand image identification, and opportunities for differentiation. It also outlines the target audience's profile, capturing public attitudes and usage toward products/brands/industries.
a. Industry Competitive Landscape:
For instance, the chart below shows the most-discussed functional food brands over a certain period. From this, brands can identify their competitors, understand their position in the competitive landscape, and aim for top-of-mind awareness among consumers. Moreover, by quoting user discussions, researchers can pinpoint issues regarding public perception of both the brand and its competitors. This allows the brand to compare, recognize problems, and take corrective action if needed.
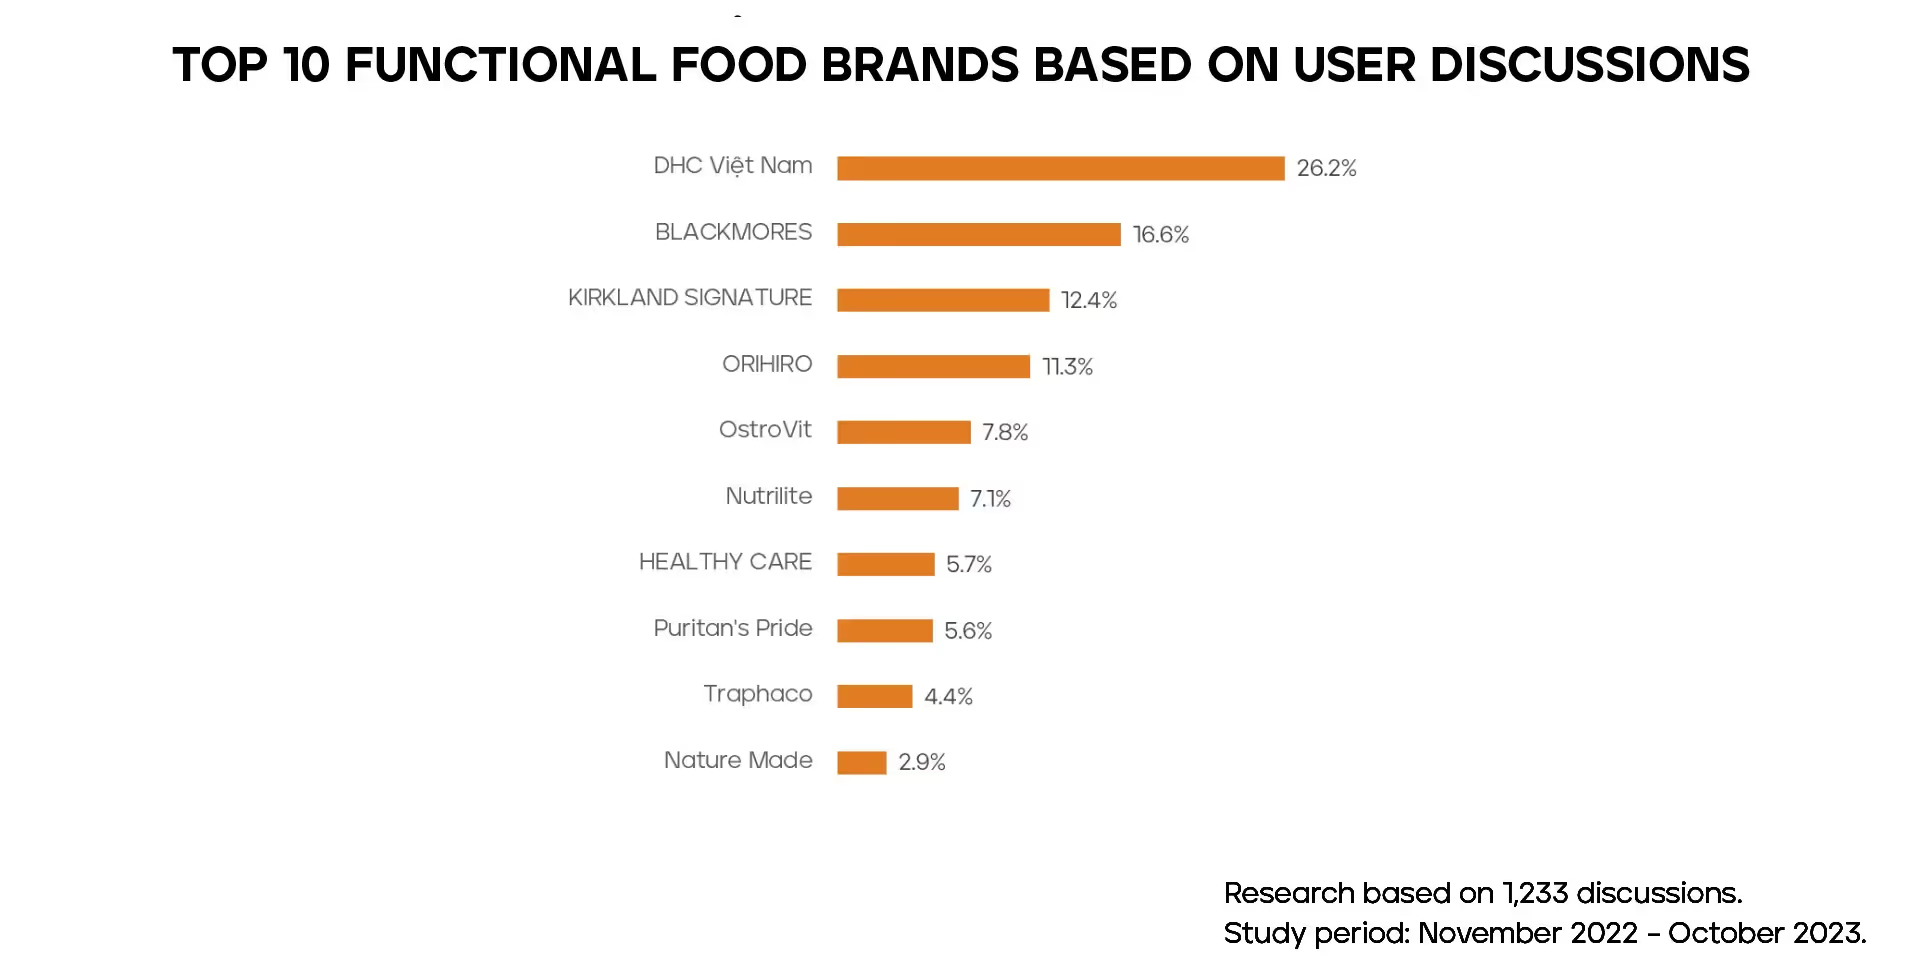
→ Read more: Exploring Insights in the Functional Food Industry: Challenges and Opportunities in the Digital Era
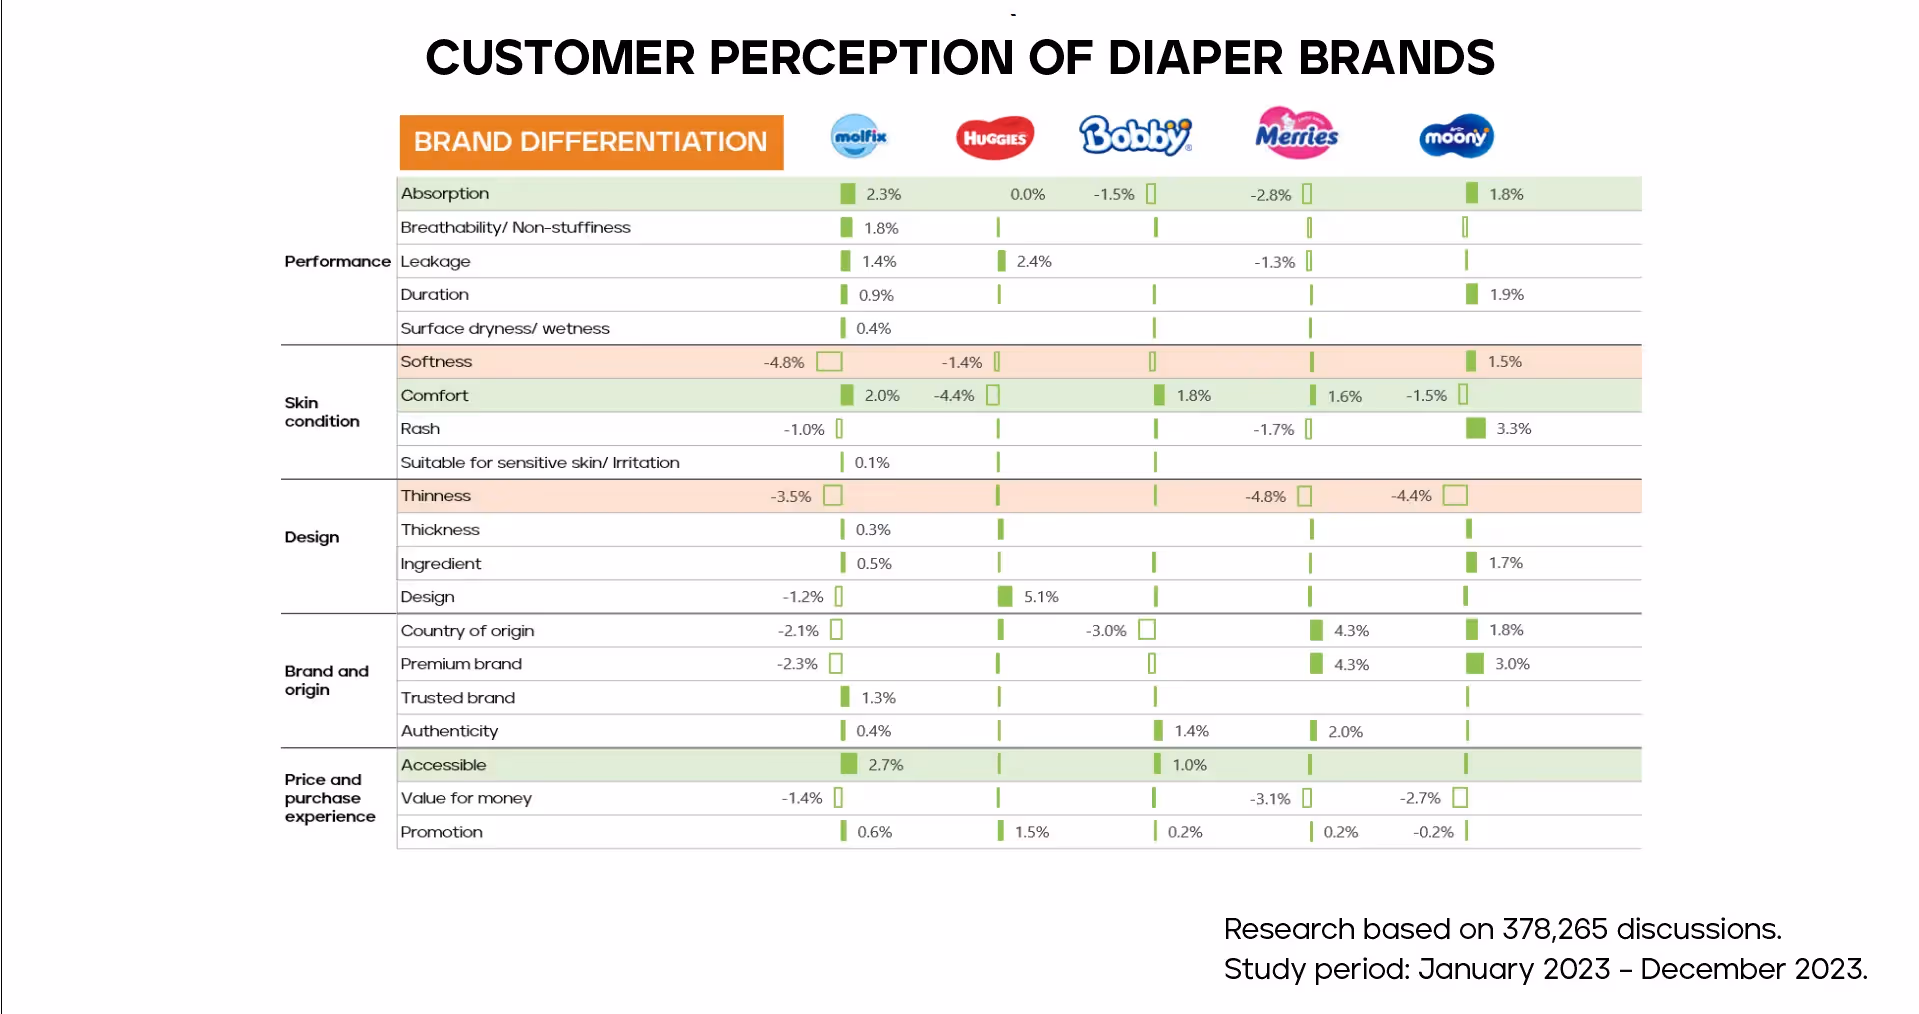
b. Brand Image and Differentiation:
An example of Buzzmetrics research on leading diaper brands paints a detailed picture of brand differentiation. Compared to other brands, Molfix’s product performs exceptionally well in absorbency. However, aspects like softness and thinness received negative feedback. Molfix’s branding team can also monitor current customer perceptions of competitors and identify areas for improvement.
c. Usage and Attitude Research (UnA):
UnA research focuses on consumer discussions and plays a key role in unveiling the consumer landscape of an industry. It addresses key questions like:
- Users' interest levels in the product/brand on social media
- Awareness, usage, and consumer behavior displayed on social platforms
- Motivations and barriers to product/brand consumption
- General satisfaction/dissatisfaction with current products/services
- Users’ needs, unmet demands, or general expectations
d. Target Audience Segmentation:
In some cases, brands aim to understand consumers not just from a product buyer perspective but from a broader context that includes their lifestyle and habits. Social Listening can support brands in achieving this.
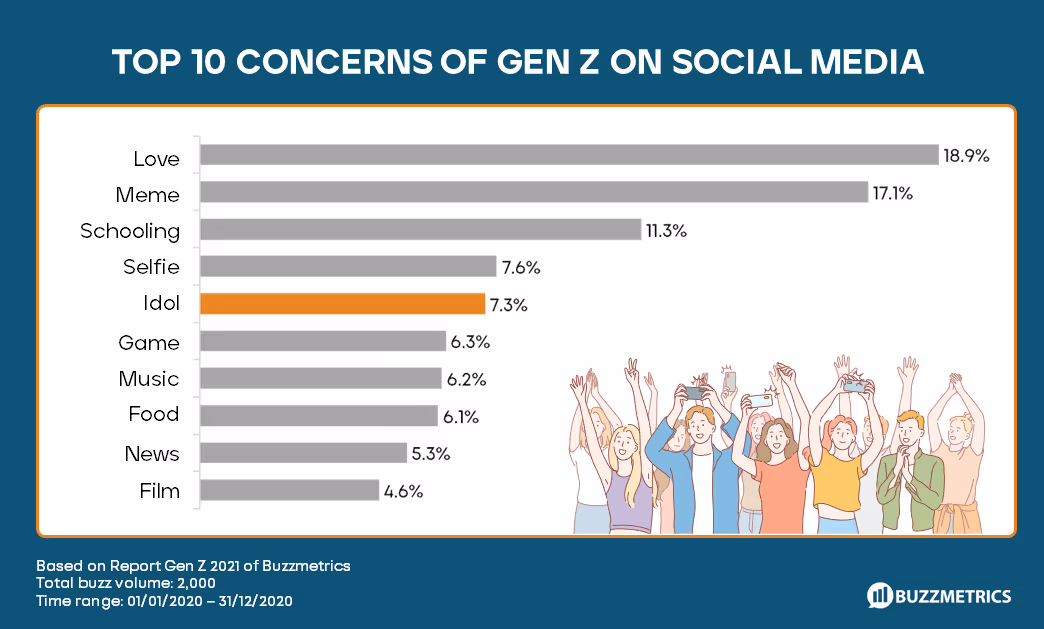
For instance, analyzing the most-discussed topics within Gen Alpha revealed that "love" was the top theme, surpassing even "education" and "games." This insight shows that to engage Gen Alpha, brands should consider using "love" as a central theme to attract attention and foster interaction.
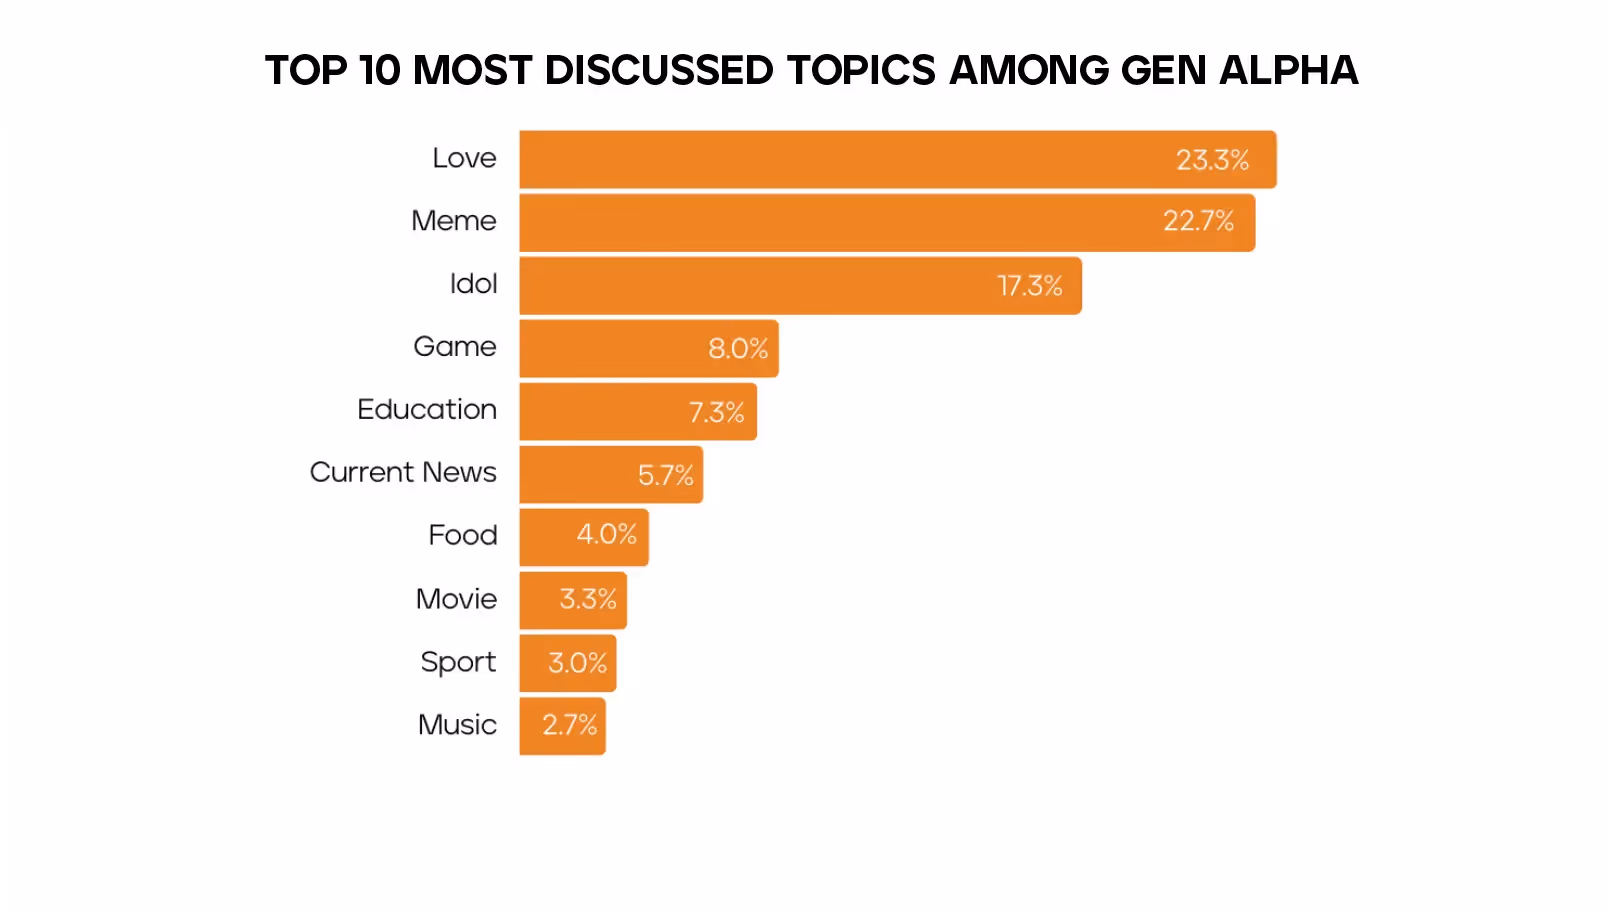
→ Read more: Gen Alpha: What Sets the Next Generation of Consumers Apart?
Notably, social media is segmented by interests. Therefore, identifying user groups and their main concerns is crucial in segmenting the social media audience. Pinpointing key interests and insights will help brands align their marketing tactics with user interests. As a result, branded content and messaging are more likely to appear in users' feeds, capturing attention, generating engagement, fostering recall and affinity, or even leading to user-generated content (UGC) related to the brand.
Social Listening supports marketers in planning, creating content, and adjusting strategies in real time throughout all phases of a campaign. It helps track brand sentiment and ensures campaigns align with audience expectations.
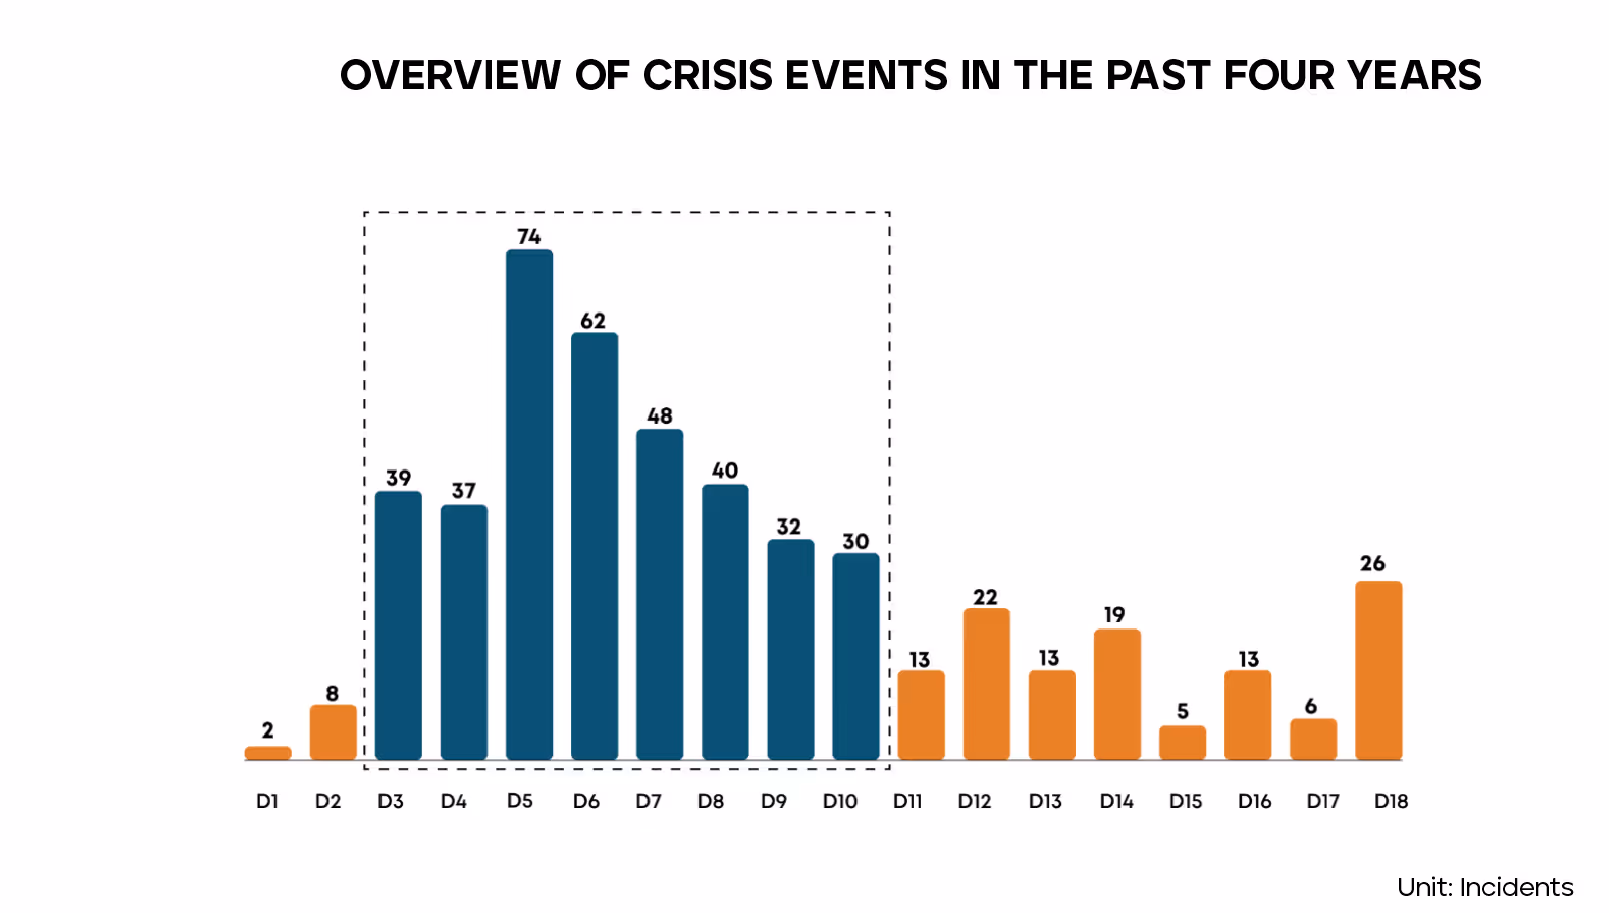
Today, even a small complaint on Facebook can cause significant damage to a brand. As consumers become increasingly familiar with social media, the likelihood of crises occurring rises. Our Social Listening data shows that while the number of crises has decreased as brands take a more proactive role in crisis management, the average scale of a crisis has grown significantly.
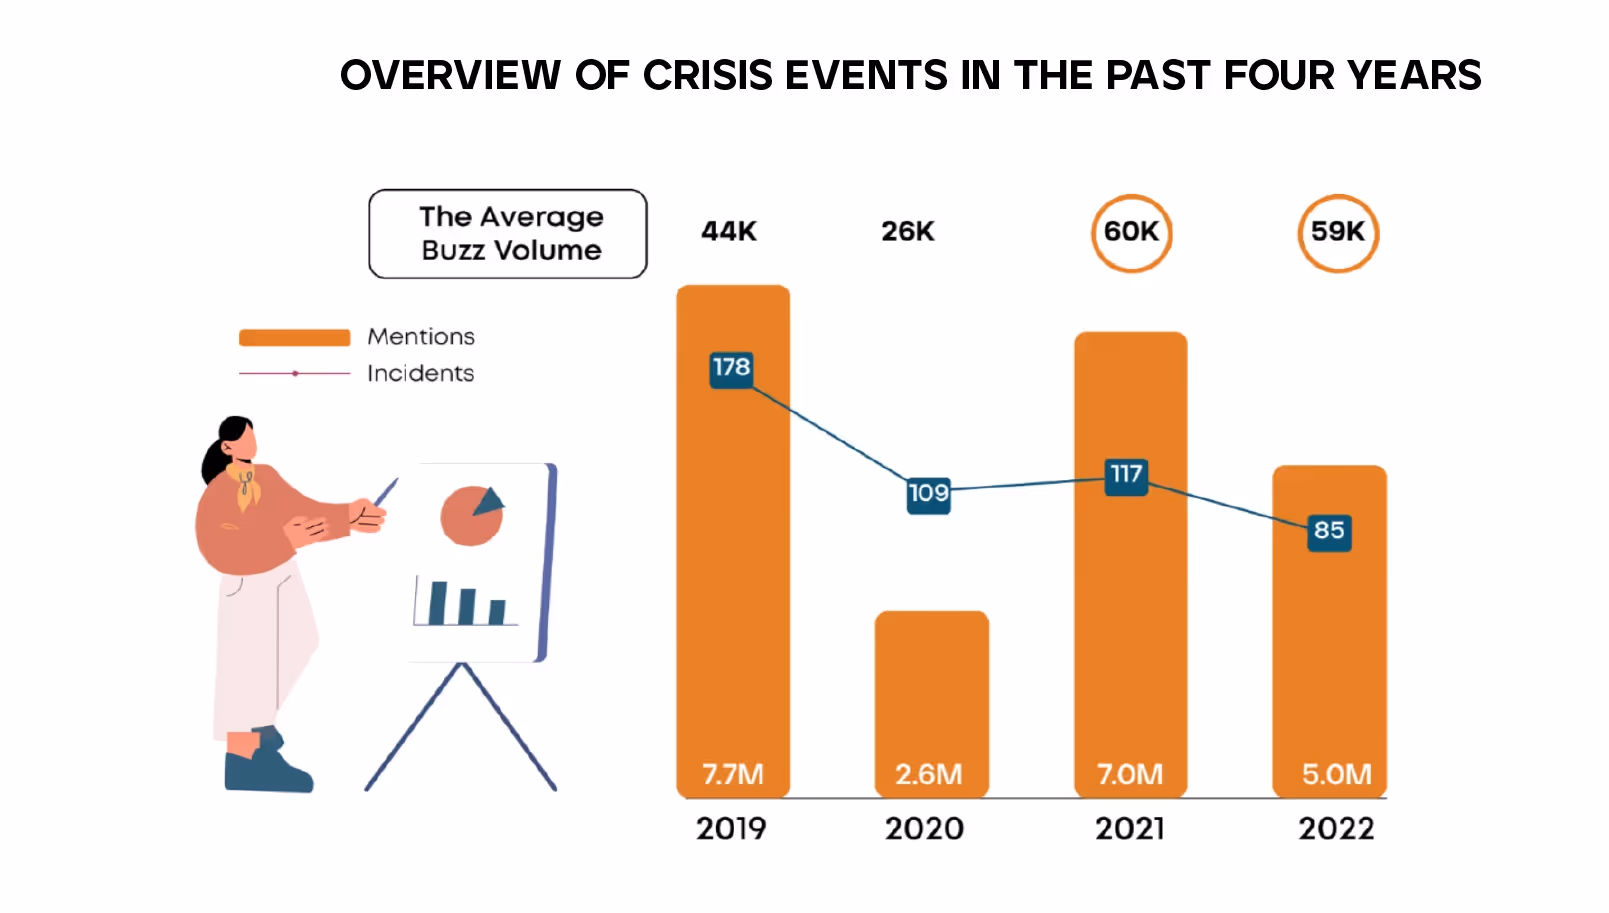
Crises may seem to occur randomly and can impact any brand for seemingly arbitrary reasons. This makes social media crises difficult to track and challenging for brands to respond to. However, through Social Listening, not only can crises be monitored, but their patterns can also be identified, allowing brands to develop strategic response plans.
By analyzing user discussions on social media and providing actionable insights to brands, Social Listening plays a critical role in shaping communication strategies. The most common applications of Social Listening include gathering insights, tracking campaign performance, and managing crises.
To learn more about metrics, marketers can refer to here

Social Listening is a type of research done by “listening” to discussions on social media. Identifying the right campaign tracking metrics right from the pre-campaign stage is important, as it will help the brand have a clear direction for creative ideas. Moreover, during the implementation of the campaign, the constant monitoring of these indicators helps to adjust, optimize and allocate resources accordingly.
Social Listening is a type of research done by ”listening to discussions on social media. Properly identifying Campaign Tracking metrics right from the pre-campaign stage is important, as it will help brands have a clear direction for creative ideas. What's more, in the course of a campaign, constant monitoring of these metrics helps to adjust, optimize, and allocate resources appropriately. Does the brand have a grasp of the necessary Campaign Tracking metrics & how to combine them for the most accurate assessment? The article below will help to summarize the basic indicators that are commonly used in the social listening reports by BuzzMetrics.
There are many indicators to assess the creative effectiveness of the campaign. However, Campaign Tracking metrics can be classified into two large groups: (1) Awareness and (2) Discussion Quality, which correspond to two major questions:
Buzz Volume is an indicator of how noisy a topic is. This is the most basic unit of measurement in Social Listening. Every post, comment, or share related to a brand's campaign counts as Buzz. This indicator will help the brand answer the question: How many discussions about the campaign on social media?
For example: Campaign A generated 100 posts, 1,000 shares, and 2,000 comments. So, campaign A collected 3,100 buzz.
Share of Voice is an indicator that compares the amount of discussion a brand generates compared to its competitors during a campaign run.
Competitors here are campaigns that compete for influence on social networks. With social media, it can be campaigns by other brands in the industry, other campaigns of the same type, or other campaigns running at the same time
This indicator indicates whether the campaign is attracting more attention than the competitors. And this rate depends on the competitor & the number of competitors the brand compares with. SOV is a relative indicator, which depends a lot on who the brand's perspective is looking to compare directly with.
For example:In May 2020, there were 2,000 buzz talking about the B brand. Meanwhile, 8,000 buzz is about other brands in the same industry. So, the Share of Voice of Brand B will be 2000/ (2000+8000) = 20%.
Audience Scale is an indicator of the number of participants in a public discussion about a research topic (event/campaign/brand). A user can generate a lot of buzz (by sharing a post multiple times). And 1,000 buzz generated by 1,000 people will mean a lot different than 1,000 buzz generated by 100 people. So, this indicator shows the degree of spread of the campaign (virality).
For example: Between November 1, 2019 and January 15, 2020, the New Year campaign “Generali - Song Nhu Y” garnered 31,603 buzz and was discussed by 17,606 people. On average, one person generates 1.8 campaign discussions.
Sentiment Score is an indicator of how users feel about a brand's campaign. This indicator is calculated by the formula: (Positive Discussion - Negative Discussion)/(Positive Discussion+Negative Discussion), whose value is in the range of [-1,1]. Getting closer to 1 means that positive discussion is absolutely overwhelming the amount of negative discussion. Conversely, a low value can be an early sign of a crisis. A Buzzmetrics study shows that 1 negative discussion can be nullified by 4 positive discussions. Therefore, this indicator is recommended to be between 0.58-1.
Brand Mention is the amount of discussion that directly refers to the brand name. The metrics indicates a user's interest and remembrance of the brand. Any user comment, whether positive or negative, that mentions the name of the brand is counted as a brand mention. Brand names include official names, Vietnamized names and other variations.
Message Recall is the amount of discussion directly referring to the message of a campaign.
Every social media campaign comes from an idea and is encapsulated in a certain key message. Any user comment that mentions that information counts as a Message Recall.
The indicator helps brands answer the question: Do users recognize the message the brand wants to send?
For example:In Biti's “Go Back” campaign, user discussions containing the keywords “reunion,” “meeting,” “home” count as Message Recall.
Relevant Buzz volume is an indicator of brand-related discussions, which includes Brand Mention and Message Recall.
For example: Still in Biti's “Go Back” campaign, although users do not mention “reunions”, they ask where to buy shoes or how much they cost. These questions count towards the Relevant Buzz Volume.
Attribute Mention is the amount of discussion that mentions product or service attributes. This indicator reflects whether the campaign interested users in product attributes.
One of the campaign goals may be to build a brand image. To achieve this goal, brands must build content and lead discussions around brand image attributes.
The indicator helps brands answer the question: Do users recognize or care about the strengths of the product?
Paid media are channels that are paid to run content. Owned media are channels owned by the brand. Meanwhile, Earned media is an organic channel, when the customer himself becomes the speaker for brand. Earned Media can be viewed as a result of Paid media and Owned media. Each user comment or share is counted towards Earned Media.
Determining the ratio of the three types of media will help brands and agencies to know that with numerical How much discussion can be generated by paid media, the equivalent of knowing how much each discussion will cost the brand. Thus, the brand will evaluate the effectiveness of the communication channels.
For example: There are two media campaigns that together generate 100k buzz. However, campaign A had 67% of discussions generated from earned media, while campaign B had only 32% of discussions generated from earned media. This shows that campaign A uses fewer resources but still has the same impact as campaign B (in terms of discussion volume). In terms of the quality of the discussion, the A campaign is better because of the high level of user discussion.
As much as possible: “I need to satisfy as many indicators as possible”
These aforementioned indicators had the role of measuring & evaluating the performance of brands/campaigns after a period on social networks. This means that after running the campaign, they measure all Campaign Tracking metrics & assume that “The better these metrics, the better the brand activity implies”.
However, each indicator has its own meaning, responding to a separate marketing goal. And the brand's job is to answer the question “What does my social media marketing campaign need to work for?“. Then, find the right set of KPIs & use it to orient the active sequences
Therefore, instead of trying to do well with every possible indicator, the brand should focus on those that are really important, which are related to the goals of the campaign. This helps to better focus & distribute resources
Further reference:
The Higher the Better: “The Higher the Buzz Volume, the Higher the Sentiment, the Better”
“How much is enough” is the second question that needs to be answered. The KPI must be in line with the discussion situation of the industry & the level of user interest. Too high or too low doesn't help brands properly evaluate their social media efforts.
For this, brands should refer to Buzzmetrics benchmarks.
So, how do I choose the right metrics and identify benchmarks for my campaign?
The choice of campaign tracking indicator depends on many factors, including: the goal and type of campaign, the characteristics of the product industry, the nature of the message. The form of research itself will also affect Campaign Tracking. For example, a new product promotion campaign will pay attention to the indicators that indicate the user's intention to buy, while a community campaign will be interested in the user's support actions (share posts, draw endorsements, etc.)
Often, the questions that are asked to help determine the indicator are:
In addition to the indicators of the campaign tracking report, the brand can also refer to the indicators from Ecommerce Auditing reports to look at how effective a campaign reflects on a brand's sales performance on e-commerce sites. Further reference: Video on how to evaluate and measure the creative effectiveness of a social media campaign or Contact Buzzmetrics.